
Selecting Time Series
To read a time series to Excel you have to put its name into the "Name" field of the "Time series" area. You can do this by either typing its name into the field, or selecting it via Time series Search. By clicking the "Open" button it is read into a new Excel Workbook. If you open the "Open" button's drop down you also get the option to open the time series in a new Excel Worksheet.

Unit, Period and Resolution

In this area you can choose the settings for reading the time series in Excel:
|
Interval |
The interval in which the template should be generated. Following possible intervals are available per default:
|
|---|---|
|
Unit |
The unit that should be applied to the time series in the template. The unit will be converted from the time series actual unit automatically if possible. If you take a time series with the unit kW and you choose to read it with the unit MW the conversion will happen automatically. If you choose to read it with the unit € no conversion will happen. The unit will be displayed in the Excel Worksheet in row 17. |
|
from |
The starting day of the template. |
|
to |
The ending day of the template. |
|
Start of day/end of day |
If this checkbox is activated you can set a time other then 00:00 for the starting and ending day |
|
descending |
If this checkbox is activated the time series is read in descending order. |
|
period from template |
If this checkbox is activated starting and ending day are taken from the template. |
|
missing as null |
If this checkbox is activated missing values are not displayed. Their cells are left empty. |
|
all sheets |
If this checkbox is activated the settings above apply for all sheets of the current Workbook. |
Update
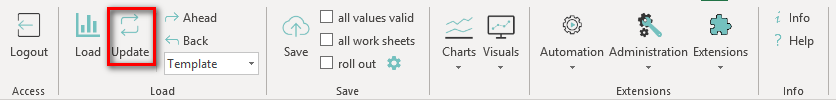
The latest version of a time series can quickly be loaded, by clicking on “Update”. This will update the current Excel Workbook with data from the data base. For this purpose, it is required that all parameters exist in the template. It is decisive for the processing of all components that the checksum row (Row 15), at which the TSM is determining the number of components, is throughout filled.
The Unit “none”
All time series are read-out without unit and one-to-one from the data base. The time series units are erased from the respective time series. The checksum unit is replaced by “checksum []:”.
End of the Date Area
The first empty cell of column A after row 18 marks the end of the date area.
Checksum
The checksum (in row 15) is recalculated according to resolution and unit at each reading procedure. If there is a formula (e.g. “=SUM (A18:A96)”) in this cell, the formula is not overwritten by the TSM.
Application
The TSM is designed as an integration tool. I.e. the procession of data is carried out by PlugIns. In row 9 the data base connection and the name of the used PlugIn are displayed.
Parameter area
Rows 2-8
Rows 2-8 can be used for parameters of a PlugIn. So these rows are PlugIn specific.
E.g.: If you use a KISS-A template the first row is used for the date and 2-8 are used for KISS-A specific parameters:
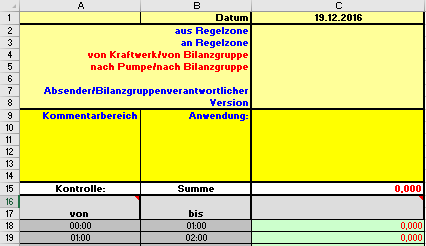
Note that KISS-A templates are used in the Austrian energy sector only, but this behavior may apply to other plug-ins as well.
For a HAKOM time series the first row is not relevant. The Rows 2-8 are reserved for attributes. If a time series was assigned an attribute you can see its value by writing the attributes name in one of the cells and then click "Update".
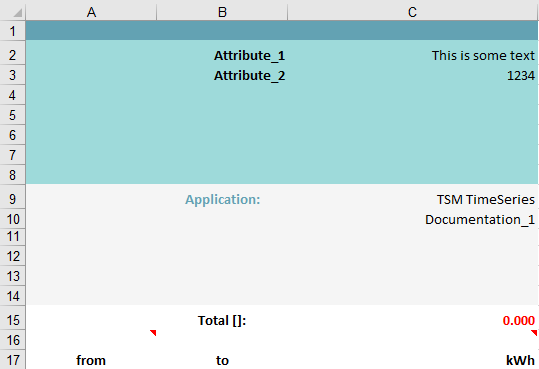
Rows 9-17
The rows 9-17 are used for time series-specific parameters:
|
9 |
This row contains the name of the database connection as well as the name of the PlugIn. |
|---|---|
|
10 - 14 |
These rows contain plug-in specific data. Detailed information about these parameters can be found here: Reading Time Series |
|
15 |
This row contains the checksum. It is recalculated with each reading process depending on the grid and unit. If there is a formula in the totals line of the template (e.g. : " =SUM( A18:A96)" ), this formula will not be overwritten by the Time Series Manager. How the checksum is calculated depends on the aggregation method chosen for it. This method, in turn, can be determined in different ways (the higher the ranking in this list, the higher the priority):
Configuration of unit conversions
It is possible to assign a unit for work to a unit for power. If this is the case, the calculated average or the calculated sum will be converted into the unit of work. However the aggregation method is still selected according to the order listed above. For certain units, default values are defined in the configuration. Additional units can be added manually in the configuration file. More information can be found here: TSM Operators - Configuration Example:
|
|
16 |
This row is used for update commands (See below). |
|
17 |
This row is reserved for a unit. If a unit, which doesn't match the time series' unit in the database, is entered in this row, the time series' values are converted to this unit automatically. To illustrate this optically the converted values are marked with the status "missing" in red. This feature requires a conversion unit for the time series' unit in the database or a conversion time series assigned to the time series that is to be converted. |
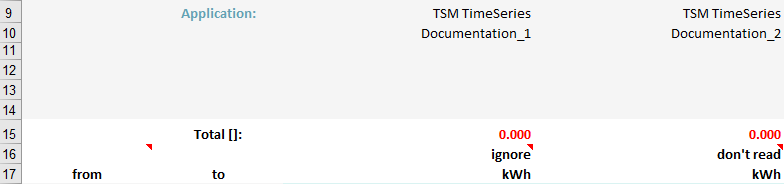
Commands
In the row 16 of the column to read-out, commands can be entered.
|
Command |
Function |
|---|---|
|
ignore |
The content of this column is being ignored when reading to Excel or saving to data base. |
|
No reading/don't read or only writing |
When the template is read-out again to Excel, the content of this column is not reloaded. The values are used for saving to data base. |
|
No writing/don't save or only reading |
The content of this column is reloaded when the template is read-out again. The values are not used for saving to data base. |
Time zone
The cell A16 can be filled with a time zone specification. Additional to the time zones supported by Microsoft (https://support.microsoft.com/en-us/help/973627/microsoft-time-zone-index-values) the following options are defined by HAKOM:
|
Value |
Time zone |
|---|---|
|
local |
Local time zone |
|
UTC |
UTC |
|
UTC-1..9 |
UTC-1..9 |
|
UTC+1..9 |
UTC+1..9 |
|
WET, GMT, WEZ |
UTC |
|
MEZ, CET |
UTC+1 |
|
OEZ, EET |
UTC+2 |
|
CEST, MESZ |
Central European Standard Time |
|
CEST-2, MESZ-2 |
Central European Standard Time - 2 hours |
|
CEST-1, MESZ-1 |
Central European Standard Time - 1 hour |
|
CEST+1, MESZ+1 |
Central European Standard Time + 1 hour |
|
CEST+2, MESZ+2 |
Central European Standard Time + 2 hours |
|
EEST, OESZ |
GTB Standard Time |
|
EEST-2, OESZ-2 |
GTB Standard Time - 2 hours |
|
EEST-1, OESZ-1 |
GTB Standard Time - 1 hour |
|
EEST+1, OESZ+1 |
GTB Standard Time + 1 hour |
|
EEST+2, OESZ+2 |
GTB Standard Time + 2 hours |
|
WEST, WESZ |
GMT Standard Time |
|
LT24 |
Local time without clock-change (additional values from 02:00 AM - 03:00 AM are ignored respectively the values from 01:00 AM - 02:00 AM apply to this period.) |
Date area
The date area starts at row 18 and consists of the columns A and B. When using the update function the values of this area are overwritten by the actual date values from the database, which is important during the time-change from summer to winter time. The date are ends at the first empty row of column A after row 18.
Status (Flags)
Each value of a time series also has a flag assigned to it which can have any one of several possible values . Values are displayed in a different color within Excel depending on that status. When saving values from Excel, the flag of each value is updated according to its color within the sheet.

|
Flag |
Status |
Priority |
Color |
VB color code |
|
|---|---|---|---|---|---|
|
19 |
Missing |
80 |
Red |
3 |
|
|
7 |
Faulty |
60 |
Turquoise |
8 |

|
|
21 |
Estimated |
50 |
Pink |
7 |

|
|
12 |
Schedule |
40 |
Violet |
29 |
|
|
9 |
Valid |
30 |
Black |
1 |

|
|
5 |
Manually replaced |
20 |
Green |
10 |

|
|
20 |
Accounted |
10 |
Blue |
5 |

|
|
0 |
No Value |
N/A |
No Color |
N/A |
Cell is left empty |

The status of a value is of particular importance when time series data is aggregated. For example if several values of a time period are aggregated to a single value, it is assigned the “worst” status of all aggregated values. A higher value for "priority" in the above table signifies a worse status. For example if 20 values are aggregated to one and 19 of these are “valid” and one is “estimated”, the aggregated value gets the status “estimated” assigned to it. This is to guarantee that aggregation does not hide data of lower quality.
It is possible to switch the flags "Valid" and "Manually replaced" through the config entry <ShiftManuallyReplacedPriority>, so that "valid" is the "better" status.
Values without status are displayed black.
Values with status "No Value" are never considered in aggregations. They are displayed as empty cells.
Ahead/Back
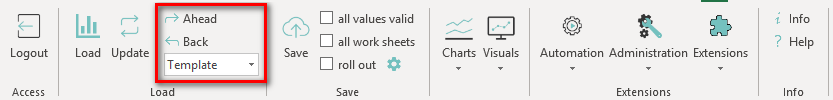
If you like to shift your time series ahead or back in time, just set the interval (day, week, hour, etc.) in the drop-down field and press ahead or back. Therefore, you do not need to reload the time series and you can shift jump to the date of time, you need to see or edit.
More Information
More information on this topic can be found here: Reading Time Series