
Reporting-Functions
Brief Description
With the help of the built-in template concept reports can be created in MS Excel very fast and simple. There is also a “Life Reporting” function available, which enables the positioning of timeseries data at any point of the reports for individual evaluations. By using these functions, timeseries values can be read to Excel free from the typical TSM format.
Functional Description
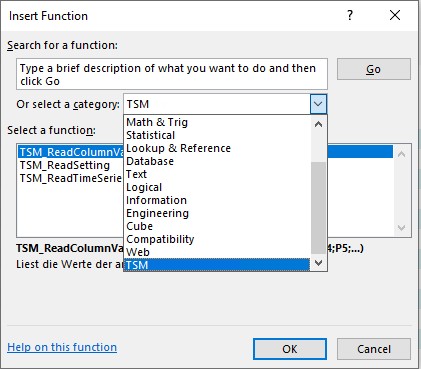
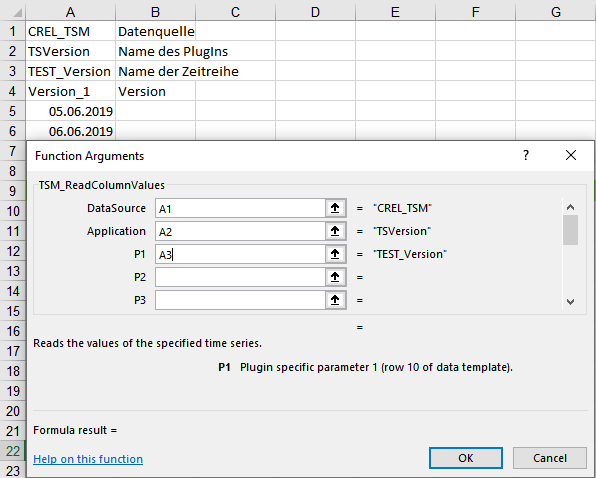
The TSM reporting functions can be accessed like all Excel functions by opening the formula assistant in Excel. The three functions can be selected by choosing the category “TSM”:
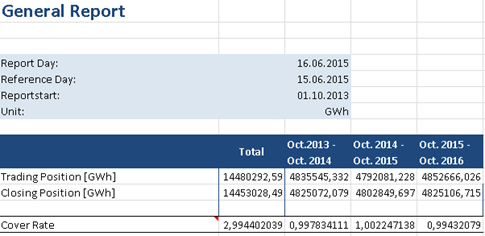
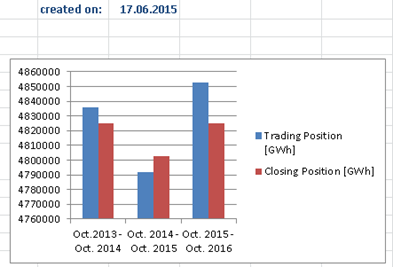
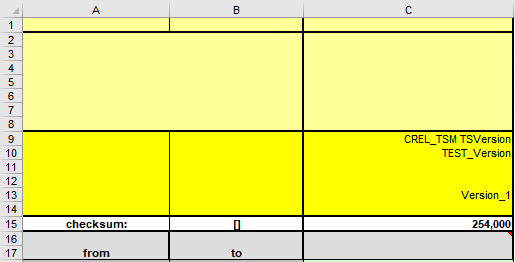
Report Example
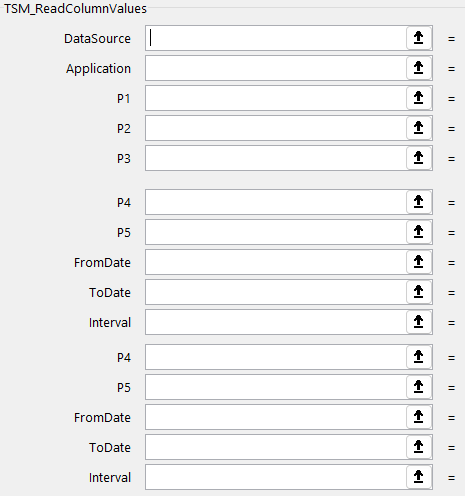
TSM_ReadColumnValues
This function is the most extensive TSM Reporting Function. It provides all possibilities of the function TSM_ReadTimeSeriesValues and includes some additional options. It reads values of time series to Excel but can also manage formulas like peak or max. Parameters like the time period where values are read from or the interval can be stated by directly entering them into the function assistant or relatively by entering Excel fields, where the value shall be taken from.
Field
|
Description
|
|---|---|
|
DataSource |
State the DB where the timeseries is saved. |
|
Applications |
State the timeseries name, where values shall be read out |
|
P1-P5 |
Parameters can be entered, which are usually defined in the Excel fields C10-C14. (P1=C10...P5=C14) |
|
FromDate |
Start date of the time period from which values shall be read out. Format: DD.MM.YYYY |
|
ToDate |
End date of the time period from which values shall be read out. Format: DD.MM.YYYY |
|
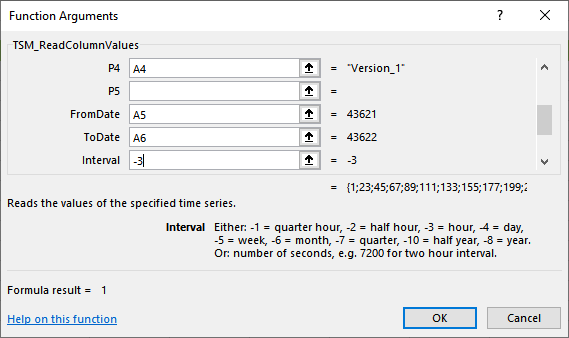
Interval |
Interval in which values shall be read out: Half Year = -10 Year= -8 Quarter= -7 Month= -6 Week= -5 Day= -4 Hour= -3 Half Hour= -2 Quarter Hour= -1 |
|
Unit |
Select the desired unit which shall be read out. If the unit from the data base shall be taken enter “DB”. If for example the timeseries is saved in KWH and GWH is selected, KWH is converted to GWH. |
|
ShowMissingValues |
Shall missing values be shown? Yes = “True”; No = “False” |
|
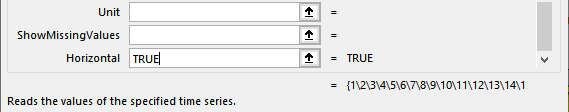
Horizontal |
Shall values be displayed in Excel horizontally or vertically? Horizontally = “True”; Vertically = “False” |
|
ShowDates |
Shall timestamps be shown? If yes (=True) the result array is now 2-dimensional. The first column will show the datetime of the selected values, which are now moved to the second column. The number format of the datetime column has to be changed to a date format in Excel/Spreadsheetgear. |
Example: Read Values from Version Time Series
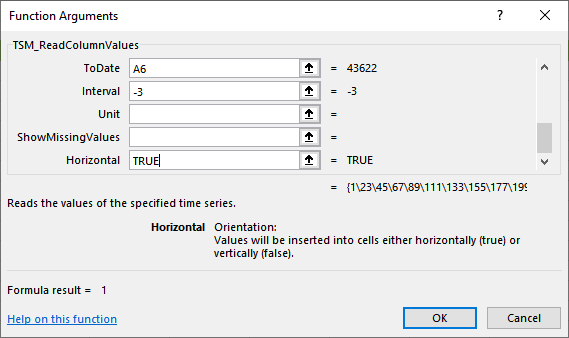
Display Several Intervals Next to Each Other
Several intervals (e.g. January, February, March, April, June) can be displayed next to each other (horizontally or vertically). Enter one TSM function in an Excel field and copy it vertically or horizontally. Afterwards, select all fields, where the values shall be entered. Insert the function and press Ctrl+Shift+Enter. This creates an array, which automatically applies the respective intervals to the fields.
Please note: If the Excel fields are arranged horizontally, the value for “Horizontal” in the TSM Reporting Function has to be “TRUE”. If the Excel fields are arranged vertically, the value for “Horizontal” in the TSM Reporting Function has to be “False”.
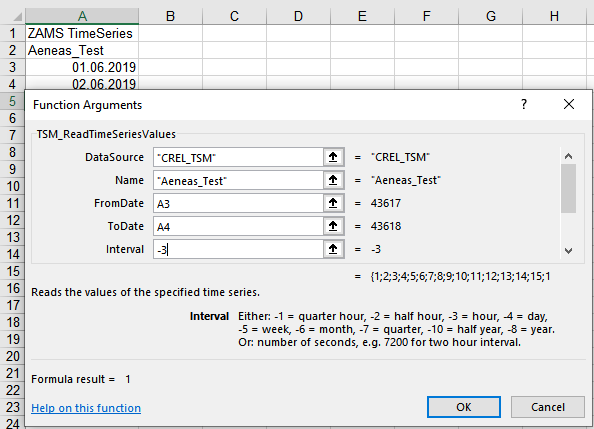
TSM_ReadTimeSeriesValues
This function is a ‘light’ version of TSM_ReadColumnValues. It provides fewer options but works exactly the same. Please see chapter TSM_ReadColumnValues for more information.
Example
Reporting Functions in TSM+
The parameters and their order are the same as in Excel. However, it must be ensured that all fields are filled in. Empty strings must be quoted with ;""; and Booleans that are "False" by default must be declared as such.
Example:
Excel:
=TSM_ReadColumnValues("CREL_TSM";"TimeSeries";"testTimeSeries";;;;;"10.12.2024";"11.12.2024";-3;;;;TRUE)
Spreadsheetgear:
=TSM_ReadColumnValues("CREL_TSM";"TimeSeries";"testTimeSeries";"";"";"";"";"10.12.2024";"11.12.2024";-3;"kwH";"False";"False";"True")
To display a formula like this, which outputs more than one value, the entire area in which the data should be, starting with the top left field, must be selected.
To insert/edit/delete the formula, press (Fn+) F2. After editing, confirm with str + shift + enter.
Before changing the value of the "horizontal" flag, the existing formular must first be deleted and then recreated using the desired parameters.
To show the timestamps using the "showDates" flat, two colums/rows must be selected.
The data format can be changed as follows:
Select column/row
Right-click > Range Explorer > Number Format > Date