
What is the HAKOM TSM App
The HAKOM TSM App
The HAKOM TSM App provides a seamlessly integrated user interface in Microsoft Excel. The TSM App allows to create prototypes for testing purposes with minimal effort. Ribbons provide all important functions for loading, calculating and saving time series. Master data can be edited either individually or grouped for recurring manipulations. A tree structure ensures that a clear overview is maintained at all times.
Just one click and time series are available in Excel. The full Microsoft Excel functionality in terms of formulas, diagrams and reporting functions can be used. Changes can be quickly, safely and reliably saved back to the source system. Creating and working with templates that can be shared within a team supports productive work and the automation of recurring tasks.
The HAKOM TSM App reliably ensures that security regulations, user authorizations and all audit and history requirements are met.
TSM App Basic Functions
The TSM App offers the following basic functions in an Excel environment:
Administrative Tasks
Manage time series definitions, including formula time series
Manage attributes
Working with Time Series Data
Retrieve / save time series data
Aggregate time series data (using different grids)
Evaluate Formula and Ad Hoc Formula
Retrieve attribute aggregates (sum of all time series with the selected attributes)
Retrieve hierarchy/node aggregates
Roll out time series data into the future
and much more.
Plug-in Architecture
HAKOM TSM App can be extended via (standard or customer specific) plugins for a variety of tasks. A number of standard plugins are already provided out-of-the-box (see TSM Plug-ins).
TSM App UI
The TSM App is integrated in Excel (see Installing HAKOM TSM App > Adding the add-in).
TSM Ribbon
All main time series functions as well as TSM plug-ins can be comfortably accessed from the ribbon:
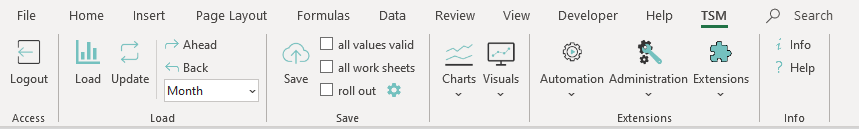
More about Ribbon functions can be found here: Basic Functions
TSM App Main Window
The main window of the TSM App can be opened from the ribbon by clicking the "Open" icon. From here, time series can be selected, the interval, the unit, the behaviour for missing values, the data source, quotations and audit functions as well as quick formula or various attribute aggregation functions can be configured to obtain time series data as you require.
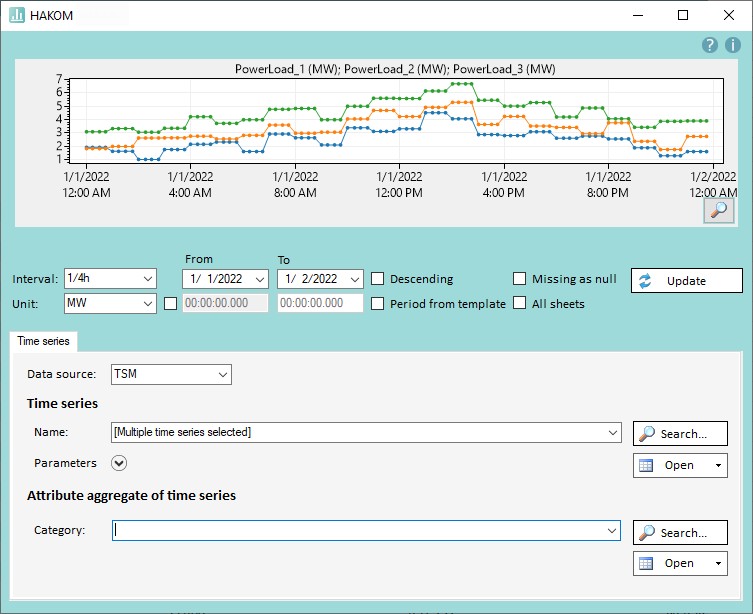
More about the TSM App UI and time series search can be found here: Starting TSM, Time Series
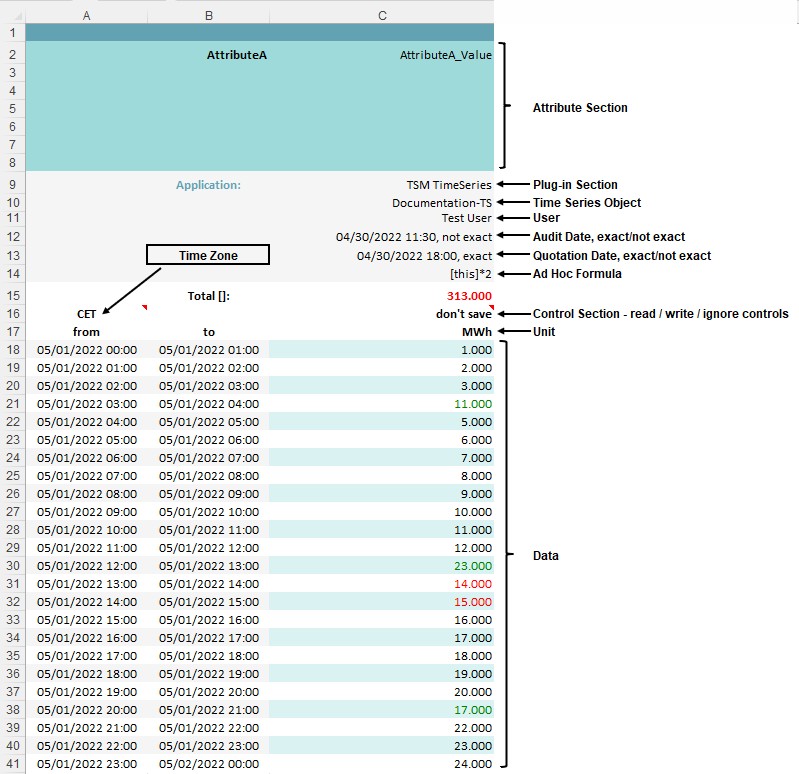
TSM Excel Time Series Template
TSM App and all time series related TSM plugins (like the Automation and Validation Server plugins) provide easy access to time series data via Excel templates.
The template contains all relevant control functions to work with time series data:
Name of the TSM plugin
Name of the time series
Audit and quotation timestamp
Ad Hoc Formula
Time zone and units
Control functions during saving and loading
Time domain and screening
Data and data quality information (see Data Quality Annotation Using Flags)
As known from Excel, besides HAKOM TSM formulas, Excel functions (Excel formula etc.) can be used to manipulate and link time series data.
Structure of the Excel Time Series Template
The TSM Excel time series template is explained in the user documentation (see Reading Data into Excel) in detail. Here is a rough overview of all template functions:
Tip
In the data area (starting from cell C18) not only data but also Excel formulas can be entered. The results can be written back in time series.
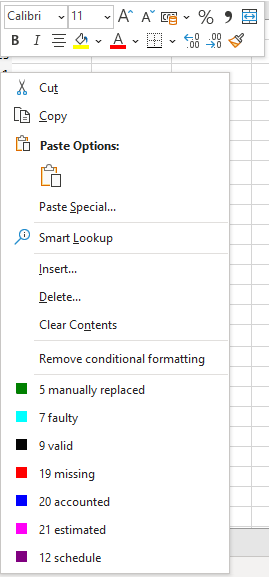
Data Quality (Flags)
Using the right-click menu, flags can be set (see Data Quality Annotation Using Flags):
TSM Excel Template in Action
The following video shows the following:
Creating a time series
Saving of time series data
Navigation in time
Roll out time series data
Use of Ad Hoc and Excel formulas
TSM Plug-ins
A number of additional standard plugins are available to assist with the following tasks:
User administration
Batch processing and validation of time series
Save / manage time series templates in database
Time series master data import / export
Holiday calendar management (for holiday-specific rollout and formula functions)
Log Monitoring
More about plugins can be found here: Standard Plug-ins
TSM Visuals
On top of standard graphics and Excel charts HAKOM TSM offers with TSM Visuals a visual time series exploration tool with special focus on data science requirements like
Correlation analysis
Pattern search
Multivariate Regression
Forecast comparisons
Data Quality Analysis
and much more.