
Contents
Preparation
For information regarding the installation of the Grafana extension please refer to: Installation of Grafana
Details regarding the configuration of the extension may be found here: Configuration of Grafana
Grafana Data Sources
The Grafana Extension provides two data source endpoints for Grafana:
-
Standard data source: A generic data source for all time series tasks. In panels and all queries around Grafana Metrics HAKOM time series are queried / listed
-
Trees data source: A node attribute aggregation data source, specifically designed for WebTSM Services Trees. In panels and all queries around Grafana Metrics HAKOM Trees are queried / listed. Node attributes are rolled out flat, i.e. main nodes and all sub nodes are listed as single entries.
Working with Grafana and HAKOM TSM
Graphics (Panels)
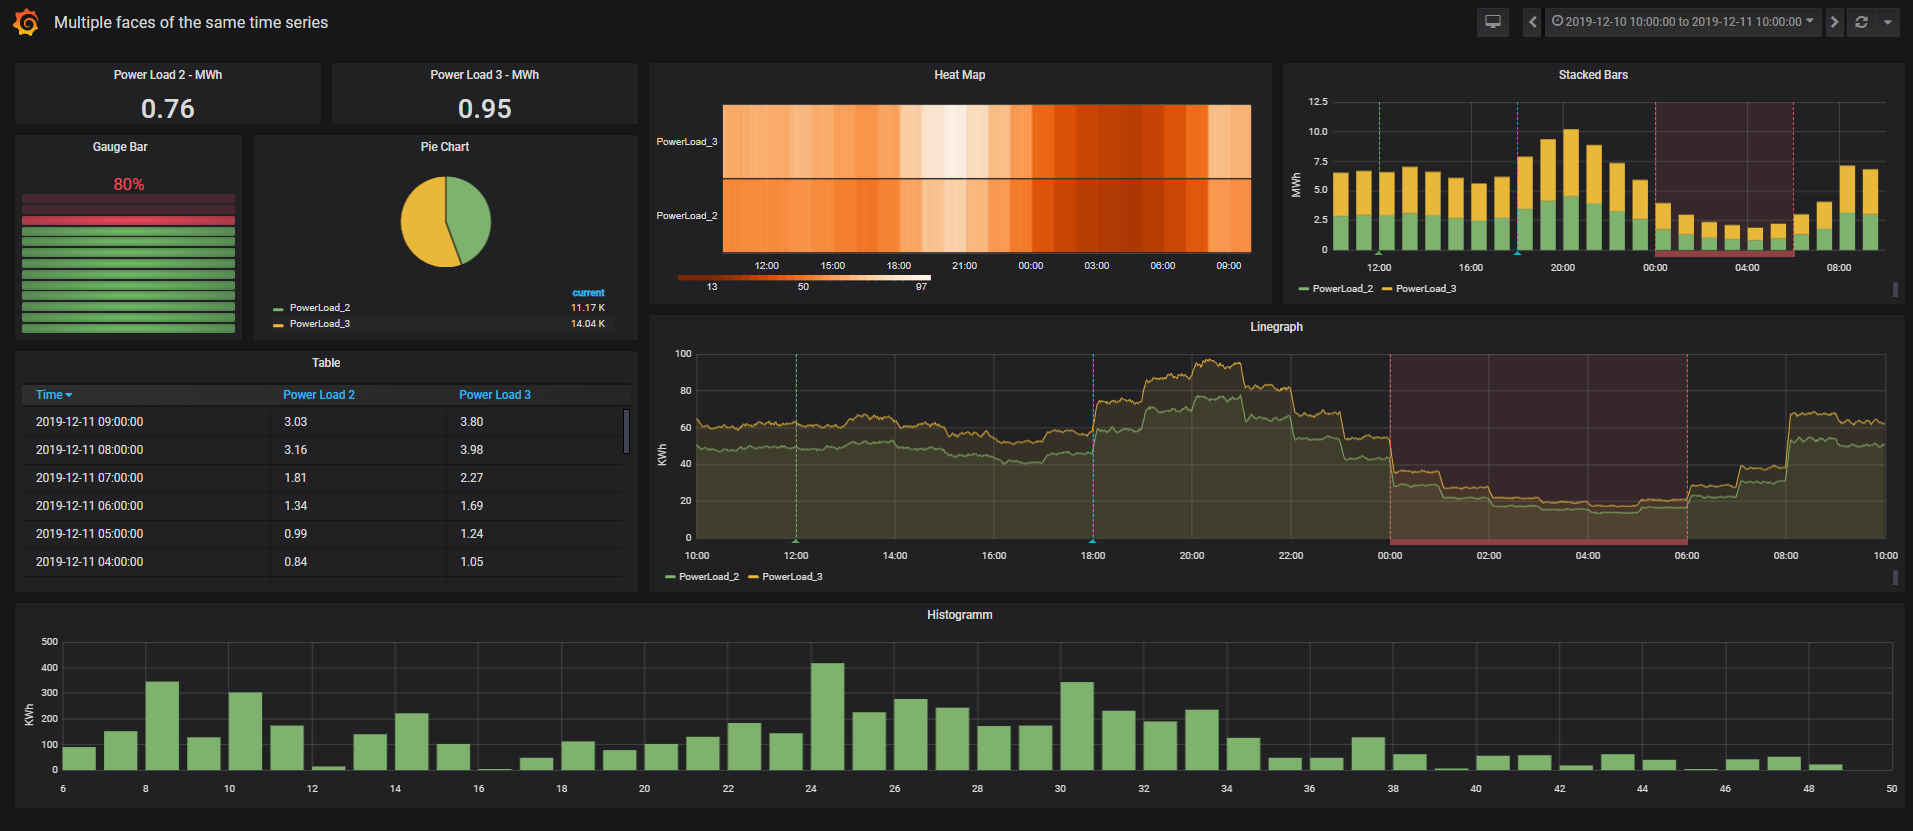
Graphics (time series) are arranged in panels. Each panel can display several time series from the same data source.
Adding Time Series
Standard Data Source
Time series for panels can be added in the following simple steps:
-
Select Query data source (e.g. JSON_DOCKER_POSGRE)
-
Add Query
-
Format as Time series or Table (NOTE: with Grafana 8.0 / SimPod 0.3.0 this setting does not exist. The system automatically uses "table", to use "timeseries" instead, add Additional JSON Data / Payload Parameter "targetType":"timeseries").
-
Metric:
-
Select the desired time series name (the list shows the first 100 hits for the respective input (an extension to several hits can be configured via HAKOM.Config LimitSearchItems)
-
- Custom Query - select as time series name (this allows you to define a time series search using the "Additional JSON Data" or Payload field (see search, or timeseriesNames)
-
Now the time series is already displayed in the graph if it has data.
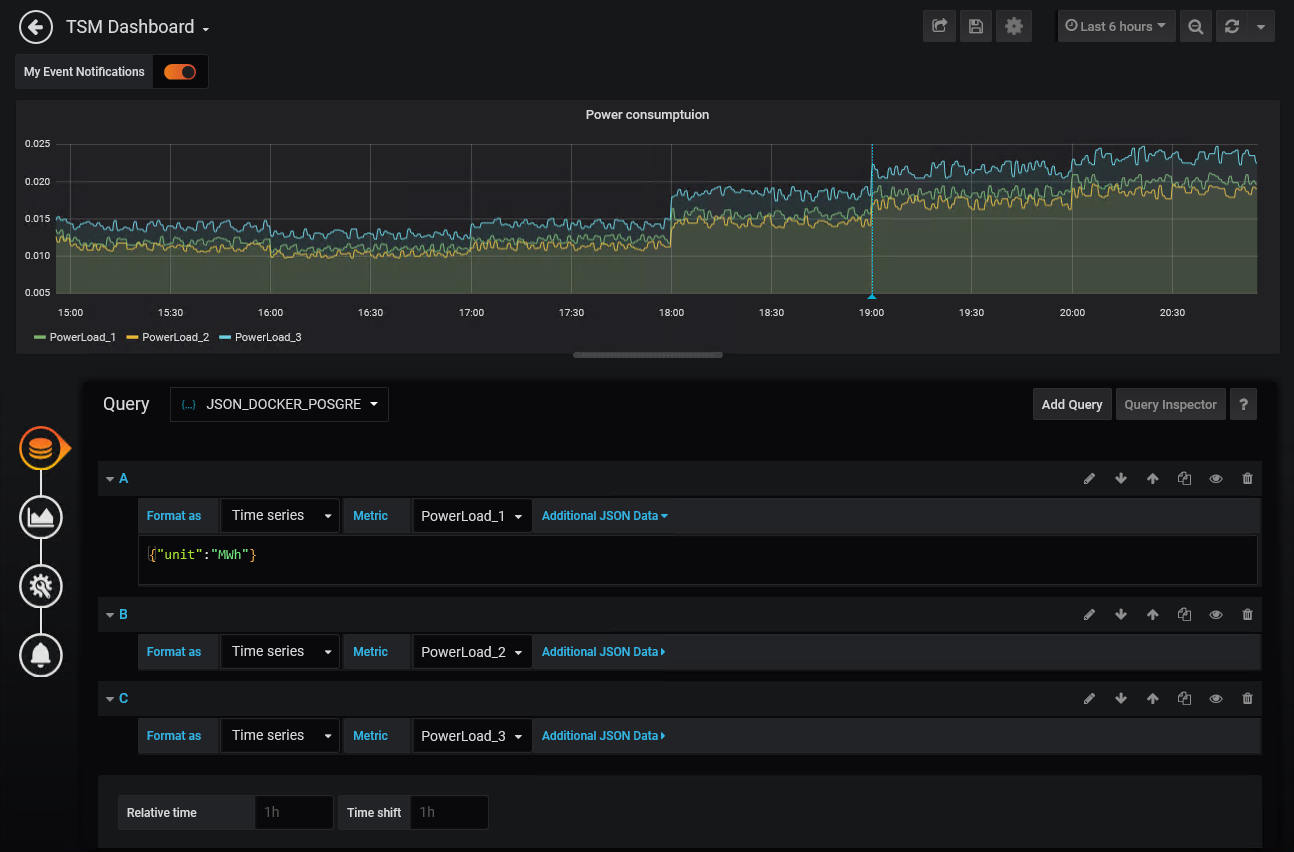
Subsequently, control functions can be defined via Additional JSON Data Field. See also Additional JSON Data Parameter / Payload
NOTE: With Grafana 8.0 / SimPod 0.3.0 a new field "Payload" is used instead of Additional JSON Data to transfer additional data to the service.
When migrating dashboards to 8.0, the Additional JSON Data content must be transferred to the new Payload field!
Trees Data Source
Node aggregates in trees data source can be added in the following simple steps:
-
Select Query data source (e.g. JSON_DOCKER_POSGRE)
-
Add Query
-
Format as Time series or Table
-
Metric: Select the desired tree node and set unit via Additional JSON Data if necessary.
Subsequently, further control functions can be added via Additional JSON Data.
Naming Conventions for Table Format
Column names are assigned according to the following rules, but can be renamed to Table Panel:
-
Time series keep their respective names (or a formulaAlias is applied as name accordingly)
-
Attribute columns:
-
If only one time series was selected, and its attributes are displayed: the attribute columns are given the respective attribute name
-
If attributes of several time series are displayed, the attribute columns are named according to the following pattern: Time series name:attribute name
-
If attributes are loaded from a time series specified in the background (sourceTimeseries) and noTimeseriesNameInAttributeHeader=false, the attribute columns are named according to the following pattern: sourceTimeseries:attribute name, otherwise only attribute names
-
-
Flag columns:
-
If only one time series is displayed, the column is called "Flag
-
If multiple time series are displayed, the column names will follow the following pattern: Time series name:Flag
-
Additional JSON Data Parameter / Payload
The following parameters can be added to the Additional JSON Data (or wih Grafana 8.0+ "Payload") field in a bracketed format.
-
Column "Format" shows for which Metric Types the parameters are supported
-
Column "Path" shows in which nodes a parameter is located
-
path root: the parameter is entered via \{"Parameter":value,... }
-
Path search or columns: the parameter must be specified in the respective node. For example \{"columns":{"allAttributes":true}}
-
|
Format |
Path |
Parameter |
Description |
Example |
Data Type |
Default Value |
||||||||||||||||||||
|---|---|---|---|---|---|---|---|---|---|---|---|---|---|---|---|---|---|---|---|---|---|---|---|---|---|---|
|
all |
root |
displayName |
Display name for time series. This parameter can be used to define the name from master data of the time series in case of saved time series. The following master data characteristics are available:
Syntax: As display name a free text can be entered, this is applied 1:1 (except + character). Instead of a free text, a component can also be referenced using square brackets (as enlisted above). To combine components with free text, a + sign must be inserted between the free text and the components. See examples beside. Restrictions: For AdHoc formula time series (see parameter "formula") only the time series name (component [Name]) can be selected from the underlying calculation template. Other properties of the calculation template time series are not accessible. If the parameter "formulaAlias" is used, it will not be overwritten by the parameter "displayName". For node aggregates (see the "TreeNodeSum" parameter), the "displayName" is applied only to the time series included in the result from includeTimeSeries but not for the nodes. |
|
String |
[Name] |
||||||||||||||||||||
|
all |
root |
targetType |
As of Grafana 8.0 / SimPod 0.3.0, the field "Format as" has been removed. As such user cannot switch between "timeseries" and"table" formats. Since some Grafana plugins only support "table" format, the system uses "table" format if nothing else specified. To change from "table" to "timeseries" format, this parameter can be used. |
"targetType": "timeseries" |
string |
"table" |
||||||||||||||||||||
|
all |
root |
audit |
Audit date |
"audit": "2020-01-01T15:00:00Z" |
ISO-8601 Datum |
null |
||||||||||||||||||||
|
all |
root |
exactAudit |
Exact Audit |
"exactAudit": true |
Boolean |
false |
||||||||||||||||||||
|
all |
root |
quotation |
Quotation date |
"quotation": "2020-01-01T15:00:00Z" |
ISO-8601 Datum |
null |
||||||||||||||||||||
|
all |
root |
exactQuotation |
Exact Quotation |
"exactQuotation": true |
Boolean |
false |
||||||||||||||||||||
|
all |
root |
unit |
Unit (not used for formula) |
"unit": "MWh" |
String |
unit of the time series |
||||||||||||||||||||
|
all |
root |
aggregation |
Aggregation (see WebTSM Service /aggregations- Ex: Sum, Average, Max, Min, MostFrequently, etc.) |
"aggregation": "Average" |
String |
|
||||||||||||||||||||
|
all |
root |
interval |
Interval (see WebTSM Service /intervals - e.g.: Second, Minute, Hour, etc. ) - if specified, the interval provided by Grafana is not used |
"interval": "Minute" |
String |
Grafana Interval |
||||||||||||||||||||
|
all |
root |
intervalMultiplier |
Interval multiplier, if interval is specified and interval multiplier is missing, 1 is assumed |
"intervalMultiplier": 15 |
Integer |
1 |
||||||||||||||||||||
|
all |
root |
exactInterval |
If activated, the query period is automatically rounded to the previous exact start of the interval. I. e. with an interval of one hour and a query start time of 13:46, the query will be rounded down to 13:00. This allows values of time series to be queried in intervals. The default value can be defined in HAKOM.config "ExactInterval". |
"exactInterval": true |
Boolean |
false |
||||||||||||||||||||
|
all |
root |
overrirdeWithGreaterInterval |
If activated and an interval and intervalMultiplier (see above) are defined in Additional JSON Data, they will be overwritten by a Grafana calculated interval or by the Grafana Interval variable, if they have a larger interval (e.g. 1 hour interval is greater than 15 minutes interval). Thus, interval and intervalMultiplier can be used as minimum interval, which can be dynamically overwritten by larger intervals. |
"overrirdeWithGreaterInterval": true |
Boolean |
false |
||||||||||||||||||||
|
all |
root |
formula |
Formula-Text - if specified, an ad hoc formula calculation is performed similar to the TSM plugin - where \[this] and \[this] blocks are replaced with the corresponding selected time series name. Attention: a \[this] should not be used with - Custom Query - because the time series does not exist. |
"forumla":"[TimeSeriesName]*[this]" |
String |
|
||||||||||||||||||||
|
all |
root |
formulaAlias |
Grafana displays the selected time series name, in case of an ad hoc formula it may be useful to display a different name instead of the time series name. |
"formulaAlias":"MeineBerechnung1" |
String |
|
||||||||||||||||||||
|
all |
root |
showNotMatchingAsNaN |
With an AdHocFilter by Attirubtes, values of a time series where the filter does not apply are displayed by default as 0 Missing by the service. To display affected time series values as missing in graphical panels, it is possible to define the value "NaN" instead of 0. In this case, time ranges are displayed without a value (i.e. without a 0 line). Note: time series columns beginning with NaN values in Table metrics are not considered as time series (known Grafana issue). |
"showNotMatchingAsNaN": true |
Boolean |
false |
||||||||||||||||||||
|
all |
root |
showMissing0AsNaN |
To show 0 time series values with Missing or NoValue flag as missing in graphical panels, it is possible to define the value "NaN" instead of 0. In this case, time ranges are displayed without a value (i.e. without a 0 line). Note: time series columns beginning with NaN values in Table metrics are not considered as time series (known Grafana issue). |
"showMissing0AsNaN": true |
Boolean |
false |
||||||||||||||||||||
|
all |
root |
timeseriesNames |
To specify a list of time series names in a query, you can specify "- Custom Query -" as metric and a list of time series names via this parameter. The system then displays these time series. Even if the specified time series could not be found using "search" (see below) Note: By default, it is not possible to use commas in the time series name due to the separator character for lists. Via HAKOM.config "IntervalVariableListSeparator" entry the separator can be changed. |
"timeseriesNames": ["TimeSeries1","TimeSeries2"] Short: "timeseriesNames": "TimeSeries1,TimeSeries2" |
\[String] |
|
||||||||||||||||||||
|
all |
root |
fullPathInSubNodeName |
Controls whether the displayed node name (if it represents a sub node) shows the complete node path to the respective sub node. Via HAKOM.config "FullPathInSubNodeName" entry the default can be changed. |
"fullPathInSubNodeName": false |
Boolean |
true |
||||||||||||||||||||
|
all |
root |
idInSubNodeName |
Controls whether the node id is displayed in the displayed node name (if it represents a subnode). Via HAKOM.config "IdInSubNodeName" entry the default can be changed. |
"idInSubNodeName": false |
Boolean |
true |
||||||||||||||||||||
|
all |
root |
search |
Parameter group for user defined time series search parameters. To activate the user defined search, "- Custom Query -" must be selected as metric. Note: this parameter group is not applied if parameter group TreeNodeSum was passed or if Trees data source is being used. |
"search": { } |
|
|
||||||||||||||||||||
|
all |
search |
name |
Name, or a part of the name of the searched time series (analog to the GET /timeseries/ name parameter of the HAKOM WebTSM Service) Note: As of WebTSM Services Release 3.8.5 (Grafana Extension 1.0.3.0), the search wildcard % must be inserted explicitly at the end of the time series names if a wildcard search is needed. Otherwise, only time series with the exact name specified will be found. |
"name": "TimeSeries1" Search with wildcard: "name": "TimeSeri%" |
String |
|
||||||||||||||||||||
|
all |
search |
names |
List of time series names to be searched. The individual time series names are linked via a logical OR for the purposes of the search. Note: As of WebTSM Services Release 3.8.5 (Grafana Extension 1.0.3.0), the search wildcard % must be inserted explicitly at the end of the time series names if a wildcard search is needed. Otherwise, only time series with the exact name specified will be found. |
"names": ["TimeSeries1","TimeSeries%"] Short: "names": "TimeSeries1,TimeSeries%" |
\[String] |
|
||||||||||||||||||||
|
all |
search |
type |
Type of the time series (type name or Id - analogous to the GET /timeseries/ type parameter of the HAKOM WebTSM service) |
"type": "Begin" |
String |
|
||||||||||||||||||||
|
all |
search |
interval |
Interval of the time series (Interval Name or Id - analogue to the GET /timeseries/ interval parameter of the HAKOM WebTSM Service) |
"interval": "Minute" |
String |
|
||||||||||||||||||||
|
all |
search |
description |
Description of the time series (analogous to the GET /timeseries/ description Parameter of the HAKOM WebTSM Service) |
"description": "TimeSeries Description" |
String |
|
||||||||||||||||||||
|
all |
search |
unit |
Unit of the time series (analogue to the GET /timeseries/ unit parameter of the HAKOM WebTSM Service) |
"unit": "MWh" |
String |
|
||||||||||||||||||||
|
all |
search |
attributes |
List of attributes, or attribute name|value pairs as array. The result is a standard time series search with attributes. All time series values of the found time series are displayed, even in time ranges, where the given attribute-value search would not return a match. Should specific time ranges, where the attribute-value pairs do not give a positive match, be displayed with 0/NaN values, the advancedAttributFilter should be used. Note: By default, it is not possible to use commas in the attribute name or value due to the list separator. Via HAKOM.config "IntervalVariableListSeparator" entry the separator can be changed. |
"attributes": ["attributeName1|Wert1","attributeName2|Wert2","attributeName3"] Short: "attributes": "attributeName1|Wert1,attributName2|Wert2,attributeName3" |
\[String] |
|
||||||||||||||||||||
|
all |
search |
advancedAttributeFilter |
List of attribute filters with comparison operators:
The search is only applied to time series where the attribute selected under Key is assigned. I.e. an attributeA!=ValueB filter lists all time series to which attributeA has been assigned a value other than valueB (at least for a timestamp of the display time range). Advanced Attribute Filters are applied to each individual time stamp of the time series. Time stamps (time ranges) where the search does not apply are displayed with 0 (or NaN) Missing. Note: By default, it is not possible to use commas in the attribute name or value due to the list separator. Via HAKOM.config "IntervalVariableListSeparator" entry the separator can be changed. |
"advancedAttributFilter": [{"key"="AttributName","operator"="!=","value"="Wert"},{...}] Short: "advancedAttributFilter": "AttributName!=Wert,..." |
\[{key,operator,value}] |
|
||||||||||||||||||||
|
all |
search |
limit |
Limits the number of returned time series (analog to the GET /timeseries/ limit parameter of the HAKOM WebTSM service). The default value can be defined in HAKOM Config "LimitQueryItems". |
"limit": 10 |
Integer |
25 |
||||||||||||||||||||
|
all |
search |
offset |
Offset, i.e. start index in combination with the number of returned time series (analog to GET /timeseries/ offset parameter of HAKOM WebTSM Service). |
"offset": 5 |
Integer |
0 |
||||||||||||||||||||
|
all |
search |
orderBy |
Sort parameter, analog to GET /timeseries orderBy parameter, time series can be sorted by several different time series properties in ascending or descending order. Individual sort commands can be listed comma separated, they will be processed in order. Sorting direction (asc or desc) can be specified after the respective time series property separated by a "|" character. |
"orderBy": "Name|asc,Description|desc" |
String |
|
||||||||||||||||||||
|
all |
search |
extendByAdhocFilter |
Search definitions where neither "name", "description", "type", "interval", "unit" or "attributes" are specified will not be executed. I.e. a metric with "- Custom Query -", without the parameters mentioned remains empty. As soon as an AdHocFilter is configured, its attributes are automatically searched for. A configured search entry ("name", "description", "type", "interval", "unit" or "attributes" is not empty) will not be extended by AdHocFilter hits. If an extension of a configured search entry by the AdHocFilter is required, this parameter must be activated via "extendByAdhocFilter":true. |
"extendByAdhocFilter": true |
Boolean |
false |
||||||||||||||||||||
|
all |
search |
executeEmptySearch |
Search definitions where neither "name", "description", "type", "interval", "unit" or "attributes" are specified will not be executed. I.e. a metric with - Custom Query -, without the named parameters remains empty. To start a search for all time series without a specific search pattern (e.g. to get closer to a certain time series with the help of "limit" and "offset" parameters) this parameter must be activated via "executeEmptySearch":true. |
"executeEmptySearch": true |
Boolean |
false |
||||||||||||||||||||
|
all |
root |
treeNodeSum |
Parameter group for trees and tree aggregates. If treeNodeSum is specified, search parameter group is ignored. |
"treeNodeSum": { } |
|
|
||||||||||||||||||||
|
all |
treeNodeSum |
name |
Name of the tree (Attribute node) to be displayed / aggregated. Attention: The name must always be specified for Standard data source. For Trees data source the name is being set automatically from the selected metric. |
"name": "MyTreeAttribute" |
String |
|
||||||||||||||||||||
|
all |
treeNodeSum |
nodeId |
Id of a node, which is to be displayed / aggregated. Note the Id = 0 always leads to the main node and can be omitted. Note: For Trees data source the nodeId is being set automatically. |
"nodeId": 10 |
Integer |
|
||||||||||||||||||||
|
all |
treeNodeSum |
includeSum |
Includes the sum of the tree node in the result. |
"includeSum": false |
Boolean |
true |
||||||||||||||||||||
|
all |
treeNodeSum |
includeTimeSeries |
Includes time series in the result. See further: sumType |
"includeTimeSeries": false |
Boolean |
false |
||||||||||||||||||||
|
all |
treeNodeSum |
includeSubNodes |
Includes sub nodes (inside the selected node) in the result. See further: sumType |
"includeSubNodes": false |
Boolean |
false |
||||||||||||||||||||
|
all |
treeNodeSum |
attributes |
List of attributes, or attribute name|value pairs as array. The result is a standard time series search with attributes. All time series values of the found time series are displayed, even in time ranges, where the given attribute-value search would not return a match. Note: By default, it is not possible to use commas in the attribute name or value due to the list separator. Via HAKOM.config "IntervalVariableListSeparator" entry the separator can be changed. |
"attributes": ["attributeName1|Wert1","attributeName2|Wert2","attributeName3"] Kurzform: "attributes": "attributeName1|Wert1,attributName2|Wert2,attributeName3" |
\[String] |
|
||||||||||||||||||||
|
all |
treeNodeSum |
timeSeriesName |
Search string for time series names. At the end of the search string, the framework assumes a wildcard search character defined in the framework. To use wildcards within the search string, use the configured wild card character (by default: %). |
"timeSeriesName": "MyTimeSeries_%" |
String |
|
||||||||||||||||||||
|
all |
treeNodeSum |
sumType |
Controls whether time series from sub nodes inside the given node or only from the selected node are displayed / aggregated.
|
"sumType": "ExcludingSubNodes" |
String |
IncludingSubNodes |
||||||||||||||||||||
|
all |
treeNodeSum |
extendByAdhocFilter |
Controls whether node selection is delegated to the Grafana AdHocFilter variable (true), or whether only node defined in the treeNodeSum is taken into account (false). If activated, a sub node selected in the AdHocFilter (for the node attribute selected in the treeNodeSum name) is used as nodeId (in case AdHocFilter operator is "="). Attention: if a nodeId was defined, it will be overridden by the AdHocFilter. |
"extendByAdhocFilter": true |
Boolean |
false |
||||||||||||||||||||
|
all |
treeNodeSum |
limitTimeSeries |
Limits the number of time series for activated includeTimeSeries. The default value can be defined in HAKOM.config "LimitQueryItems". |
"limitTimeSeries": 25 |
Integer |
25 |
||||||||||||||||||||
|
all |
treeNodeSum |
offsetTimeSeries |
Offset, i.e. start index in combination with the number of time series returned to paginate through a limited number of time series. |
"offsetTimeSeries":0 |
Integer |
0 |
||||||||||||||||||||
|
table |
root |
columns |
Control functions for attribute columns in Metric Type Table |
"columns": { } |
|
|
||||||||||||||||||||
|
table |
columns |
allAttributes |
If activated, all attributes of the selected time series are loaded |
"allAttributes": true |
Boolean |
false |
||||||||||||||||||||
|
table |
columns |
customList |
An exact list of the desired attributes loaded as columns (if assigned to the time series) can be defined using this parameter. Note: By default, it is not possible to use commas in the attribute name due to the list separator. Via HAKOM.config "IntervalVariableListSeparator" entry the separator can be changed. |
"customList": ["Attribut1","Attribut2"] Short: "customList": "Attribut1,Attribut2" |
\[String] |
|
||||||||||||||||||||
|
table |
columns |
sourceTimeseries |
Name of the time series from which the attributes are loaded into the table. If this is set, no attributes are loaded for other time series. |
"sourceTimeseries": "TimeSeries1" |
String |
|
||||||||||||||||||||
|
table |
columns |
noTimeseriesNameInAttributeHeader |
If activated, time series names in attribute columns resulting from sourceTimeseries are not displayed, but only the names of the attributes. |
"noTimeseriesNameInAttributeHeader": true |
Boolean |
false |
||||||||||||||||||||
|
table |
columns |
showFlag |
If "Id" flag id's are output as integer (can also be visualized as line), if "Name" flag names are output as string, if not specified or "None" no flags are output. The default value can be defined in HAKOM.config "ShowFlag". |
"showFlag": "Name", or"showFlag": "Id" |
None,Id,Name |
None |
Parameter Examples
Retrieve time series in unit MWh with exact audit date 2019-11-14T23:00:00Z as total aggregate
{"unit":"MWh", "audit": "2019-11-14T23:00:00Z", "exactAudit": true, "aggregation": "Sum"}
Retrieve time series in 15 minute intervals exactly at 0-15-30-45 minute grid points
{"interval":"Minute", "intervalMultiplier":15, "exactInterval":true}
Retrieve Ad Hoc formula (time series*-1) with unit "MWh" in 15 minutes interval exactly on the 0-15-30-45 minutes grid points
{"formula":"[this,0,MWh]*-1","formulaAlias":"My Inverse Time Series","interval":"Minute", "intervalMultiplier":15, "exactInterval":true}
Define time series names as a list. (For queries using timeseriesNames, you must select Metric - Custom Query -)
{"timeseriesNames": ["MyTimeSeries1", "MyTimeSeries2"]}
Time series from time series search with limit and attribute search. (For queries using search, you must select Metric - Custom Query -)
{"search": {"name": "MyTestTimeS%", "type": "Begin", "interval": "Hour","description": "My time series description","unit": "MWh",
			"attributes": ["MyAttribute1", "MyAttribute2|Value"],"limit": 100,"offset": 0}}
DisplayName Examples
Simple query with display name
{"interval": "Hour", "displayName": "[Name]+ (+[Description]+)"}
Time series search combined with display name
{"search":{"name": "Consumption%"}, "displayName": "[Name]+ (+[Description]+)"}
TreeNodeSum including time series combined with display name
{"displayName": "[Name]+ (+[ID]+)", "treeNodeSum": {"name": "$rootNodes", "includeTimeSeries": true, "includeSum": false, "extendByAdhocFilter": "$extendByAdhocFilter"}, "exactInterval":"$controlExactInterval", "unit": "MWh"}
TreeNodeSum Examples - Standard Data Source
Note: for TreeNodeSums using HAKOM.WebTSMServices 3.8.4 the unit ("unit": "desired unit") should be always provided. That ensures correct results in the desired unit.
Loads a TreeNodeSum aggregate (that is, the sum of the selected TreeNode):
{"unit":"KWh", "treeNodeSum": {"name": "MyTree"}}
Loads a subnode aggregate (that is, the sum of the selected subnode ID):
{"unit":"KWh", "treeNodeSum": {"name": "MyTree", "nodeId":10}}
Loads all time series data in the selected TreeNode:
{"unit":"KWh", "treeNodeSum": {"name": "MyTree", "indludeSum": false, "includeTimeSeries": "true"}}
Loads all time series data in the selected subnode:
{"unit":"KWh", "treeNodeSum": {"name": "MyTree", "nodeId":10, "indludeSum": false, "includeTimeSeries": "true"}}
Loads all sub-subnode totals inside the selected subnodes:
{"unit":"KWh", "treeNodeSum": {"name": "MyTree", "nodeId":10, "indludeSum": false, "includeSubNodes": "true"}}
Loads both the subnode total and all time series data and sub-subnodes inside the selected subnodes:
{"unit":"KWh", "treeNodeSum": {"name": "MyTree", "nodeId":10, "includeTimeSeries": true, "includeSubNodes": "true"}}
Loads a TreeNodeSum aggregate, which can be switched to a subnode via Grafana AdHocFilter Variable.
{"unit":"KWh", "treeNodeSum": {"name": "MyTree", "extendByAdhocFilter": true}}
Loads 5 time series data and skips 10 time series in the selected TreeNode.
{"unit": "KWh", "treeNodeSum": {"name": "MyTree", "indludeSum": false, "includeTimeSeries": "true", "limitTimeSeries": 5, "offsetTimeSeries": 10}}
TreeNodeSum Examples - Trees Data Source
With Trees data source the parameters "name" and "nodeId" are overridden by the selected Grafana Metric, so that these parameters are ignored there. All other parameters apply as described above.
Table Examples
Display time series with flags (as flag name)
{"columns": {"showFlag": "Name"}}
Display time series with all attributes and flags
{"columns": {"showFlag": "Name", "allAttributes": true}}
Define time series names as list, get flags as id (Result: for all listed time series the flags are displayed, in both line graphs and table panels. The flags are listed under "time series name:flag").
Note: to retrieve flags as name, use "showFlag": "name" instead. (For queries using timeseriesNames, you must select Metric - Custom Query -)
{"timeseriesNames": ["MyTimeSeries1", "MyTimeSeries2"], "columns": {"showFlag": "id"}}
Define time series names as list, retrieve only specific attributes (result: for both time series the listed attributes are loaded if any assigned)
{"timeseriesNames": ["MyTimeSeries1", "MyTimeSeries2"],
 "columns": {"customList": ["MyAttribute1", "MyAttribute2"]}}
Define time series names as a list, retrieve only specific attributes from only one specific time series (result: data is loaded for both time series, attributes are loaded from the designated sourceTimeseries)
{"timeseriesNames": ["MyTimeSeries1", "MyTimeSeries2"],
 "columns": {"customList": ["MyAttribute1", "MyAttribute2"], "sourceTimeseries": "MyTimeSeriesWithAttribute"}}
Retrieve time series from time series search with limit and attribute search and specific attributes defined (result: all time series found within the specified limit and the specified attributes, if assigned, are loaded)
{"search": {"name": "MyTestTimeS%", "type": "Begin", "interval": "Hour","description": "My time series description","unit": "MWh",
			"attributes": ["MyAttribute1", "MyAttribute2|Value"],"limit": 100,"offset": 0},
 "columns": {"customList": ["MyAttribute1", "MyAttribute2"]}}
Annotations
Time-related information with textual context, such as certain events in Grafana, can be recorded and displayed. Such events can also be retrieved from an external JSON data source via /annotations path. Individual annotations can be visualized as individual points in time or time ranges (region).
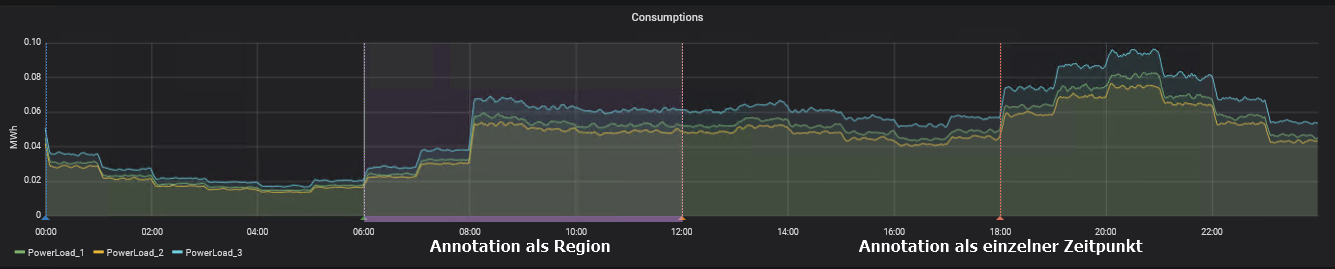
In HAKOM TSM such events can be displayed via attributes and time slices or directly via time series containing category values.
NOTE: with Grafana 8.0 / SimPod 0.3.0 the definition of annotations and the interface behind has been changed.
Query / Payload
|
Path |
Parameter |
Description |
Example |
Data Type |
Default Value |
|---|---|---|---|---|---|
|
root |
timeseries |
Name of the time series whose data or attributes to be used. Is obsolete as of Grafana 8.0. |
|
String |
|
|
root |
value |
Value of the selected time series. Only time series values that are equal to the specified value are considered. All other timestamps do not generate an annotation. |
|
Double |
|
|
root |
valueMap |
Mapping of time series values to a string. Which can be displayed as annotation text. Pattern: "TimeSeriesValue": "MappingValue" |
|
Dictionary |
|
|
root |
isRegion |
Controls whether annotation covers a time range or reflects only the start time of a given event. |
|
Boolean |
false |
|
root |
exactInterval |
If activated, the query period is automatically rounded to the previous exact start of the interval. I.e. with an interval of one hour and a query start time of 13:46, the query will be rounded down to 13:00. This allows values of time series to be queried in intervals. The default value can be defined in HAKOM.config "ExactInterval". |
|
Boolean |
false |
|
root |
groupAdjacent |
Controls whether contiguous equal time series values should be grouped to one event. |
|
Boolean |
true |
|
root |
formula |
Time series formula parameters. |
|
|
|
|
formula |
formula |
Time series formula. The keyword "this" ([this], or [this,...]) is replaced with the time series passed via timeseries parameter or via target parameter (from Grafana 8.0). |
|
String |
|
|
formula |
interval |
Interval for the formula calculation (mandatory if formula was passed). |
|
String oder Int |
|
|
formula |
intervalMultiplier |
Interval multiplier for formula calculation. |
|
Int |
1 |
|
root |
attribute |
Attribut parameters. |
|
|
|
|
attribute |
name |
Attribut name. Name of the time series attribute to be used. |
|
string |
|
|
attribute |
value |
Attribut value. Value to be filtered for. If empty, all values are displayed as Annotation event. |
|
string |
|
Annotations Before Grafana 8.0
Define Annotation From TSM Attribute
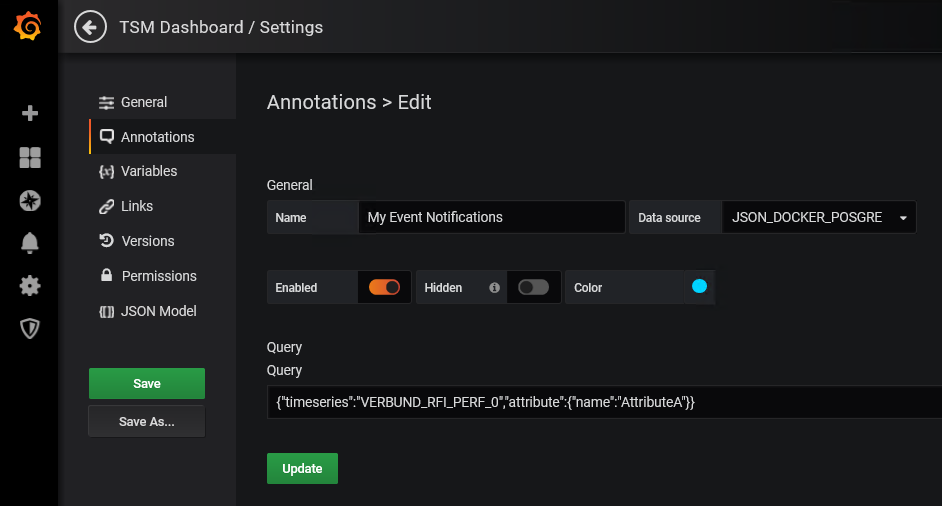
Grafana - Dashboard - Settings - Annotations - New
-
Select a name in the Annotations dialog under General
-
Select a JSON data source in Data source
-
Define, whether the annotation is displayed and with which display color to select
-
Under Query, define the search parameter for the attribute using following patterns:
-
-
Retrieve attribute without filtering by specific attribute value:
XML{"timeseries":"timeseries_name","attribute":{"name":"attribute_name"}}
-
Retrieve attribute with filtering by a specific attribute value:
XML{"timeseries":"timeseries_name","attribute":{"name":"attribute_name","value":"attribute_value"}}
-
Retrieve attribute without filtering by specific attribute value displayed as region (colored time span while the attribute value is valid):
XML{"timeseries":"timeseries_name","isRegion":true,"attribute":{"name":"attribute_name"}}
-
Retrieve attribute with filtering by a specific attribute value displayed as region (colored time span while the attribute value is valid):
XML{"timeseries":"timeseries_name","isRegion":true,"attribute":{"name":"attribute_name","value":"attribute_value"}}
-
Define Annotation From TSM TIme Series
Grafana - Dashboard - Settings - Annotations - New
-
Select a name in the Annotations dialog under General
-
Select a JSON data source in Data source
-
Define, whether the annotation is displayed and with which display color to select
-
Under Query, define the search parameter for the time series using following patterns:
-
Retrieve time series values without filtering by specific time series value use the following pattern:
XML{"timeseries":"timeseries_name", "exactInterval": true}
-
Retrieve time series values with filtering by a specific time series value:
XML{"timeseries":"timeseries_name","value":1, "exactInterval": true}
-
Retrieve time series values without filtering by specific time series value displayed as region (colored time span while the time series value is unchanged):
XML{"timeseries":"timeseries_name","isRegion":true, "exactInterval": true}
-
Retrieve time series values with filtering by a specific time series value displayed as region (coloured time span while the time series value is unchanged):
XML{"timeseries":"timeseries_name","isRegion":true,"value":1, "exactInterval": true}
-
Retrieve time series values mapped to specific text values:
XML{"timeseries":"timeseries_name", "valueMap":{"1":"Mapping Text", "2":"Mapping Text 2"}}
-
Retreive time series values of an ad hoc formula and mapped values to specific text (e.g. to display flags as annotation colours)
XML{"timeseries":"timeseries_name", "formula":{"formula":"[this].Flag", "interval":"Hour", "intervalMultiplier":1}, "valueMap":{"9":"Valid", "19":"Missing"}}
-
Note: the tag "exactInterval": true in the above examples is used to roll out the time series values exactly on the interval defined on the time series. If this is not set, the interval is shifted by the start time given by Grafana.
Annotations Grafana 8.0 and Higher
Annotations can now access time series directly. This makes the configuration of both annotations from time series attributes and annotations from time series more intuitive.
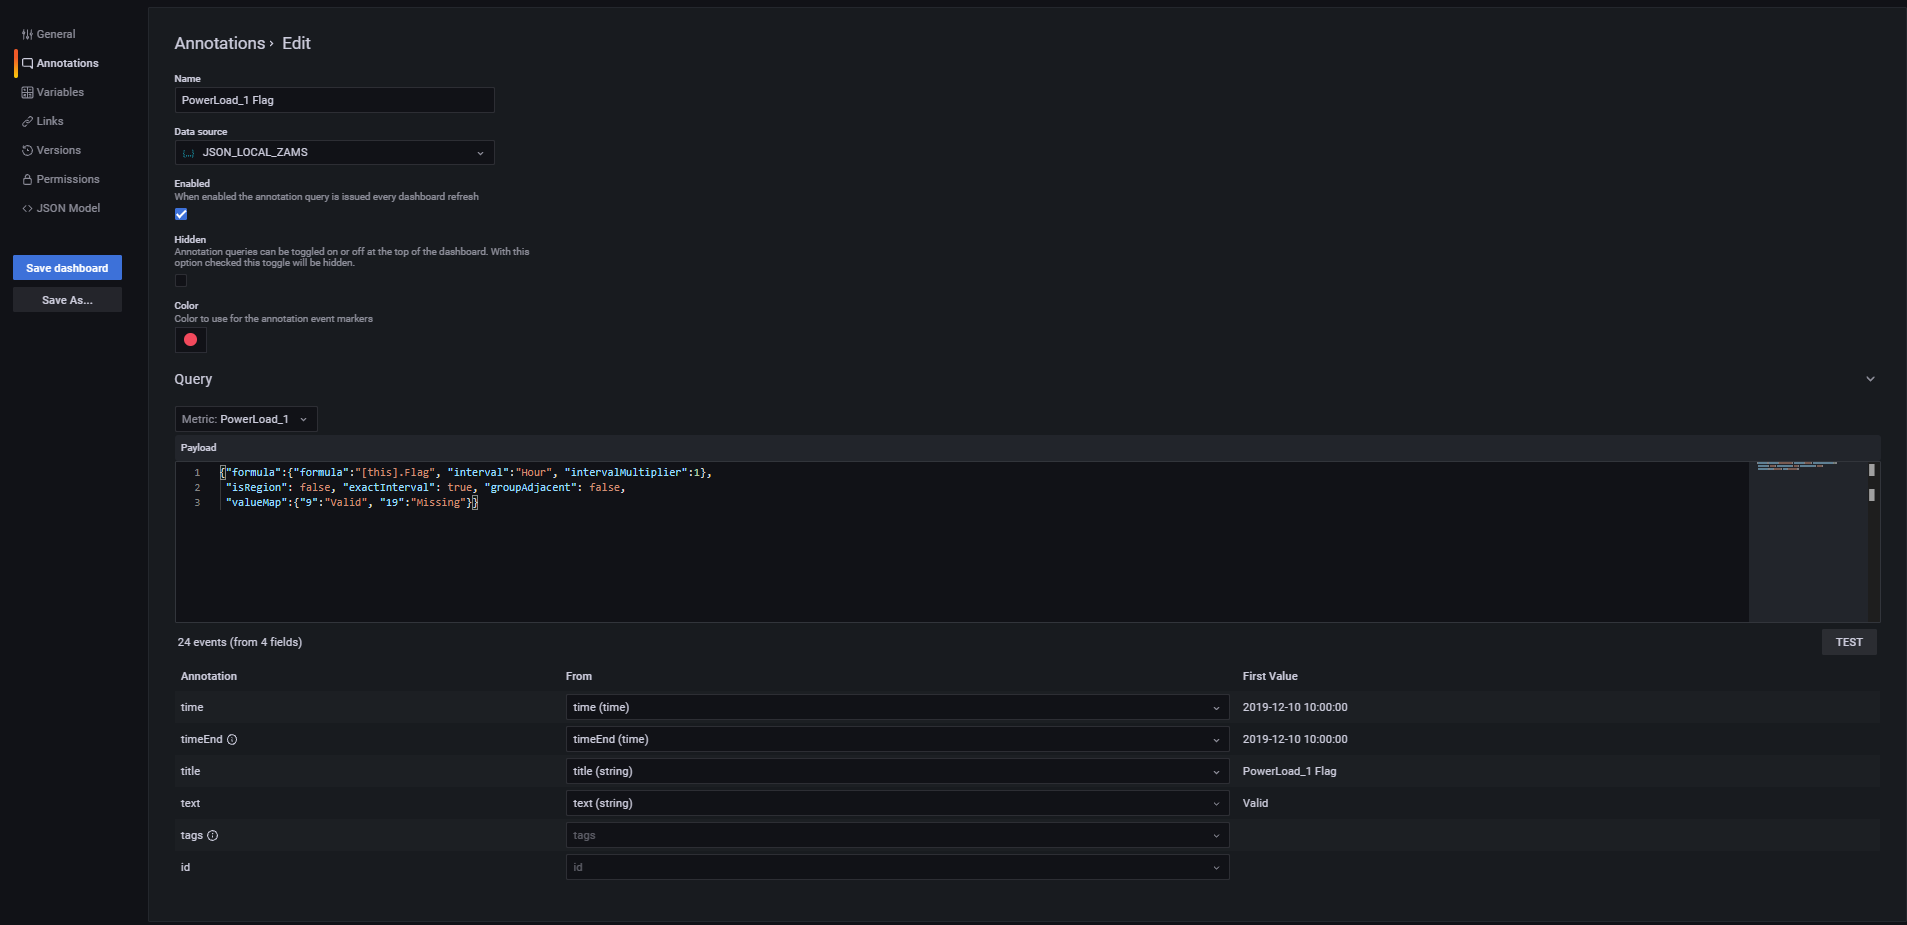
Define Annotation From TSM Attribute
Grafana - Dashboard - Settings - Annotations - New
-
Select a name in the Annotations dialog under Name
-
Select a JSON data source in Data source
-
Define, whether the annotation is displayed and with which display color to select
-
Under Query - Metric select a time series
-
Finally add additional parameter in Payload field:
-
Retrieve attribute without filtering by specific attribute value:
XML{"attribute":{"name":"attribute_name"}}NOTE: the entry "timeseries": "timeseries_name" is no longer necessary, since a time series has been selected. If this parameter is set, the system will apply its value instead of the time series selected under Metric.
-
Retrieve attribute with filtering by a specific attribute value:
XML{"attribute":{"name":"attribute_name","value":"attribute_value"}}
-
Retrieve attribute without filtering by specific attribute value displayed as region (colored time span while the attribute value is valid):
XML{"isRegion":true,"attribute":{"name":"attribute_name"}}
-
Retrieve attribute with filtering by a specific attribute value displayed as region (colored time span while the attribute value is valid):
XML{"isRegion":true,"attribute":{"name":"attribute_name","value":"attribute_value"}}
-
Define Annotation From TSM Time Series
Grafana - Dashboard - Settings - Annotations - New
-
Select a name in the Annotations dialog under Name
-
Select a JSON data source in Data source
-
Define, whether the annotation is displayed and with which display color to select
-
Under Query - Metric select a time series
-
Finally add additional parameter in Payload field:
-
Retrieve time series values without filtering by specific time series value use the following pattern:
XML{"exactInterval": true}NOTE: the entry "timeseries": "timeseries_name" is no longer necessary, since a time series has been selected. If this parameter is set, the system will apply its value instead of the time series selected under Metric.
-
Retrieve time series values with filtering by a specific time series value:
XML{"value":1, "exactInterval": true}
-
Retrieve time series values without filtering by specific time series value displayed as region (colored time span while the time series value is unchanged):
XML{"isRegion":true, "exactInterval": true}
-
Retrieve time series values with filtering by a specific time series value displayed as region (coloured time span while the time series value is unchanged):
XML{"isRegion":true,"value":1, "exactInterval": true}
-
Retrieve time series values mapped to specific text values:
XML{"valueMap":{"1":"Mapping Text", "2":"Mapping Text 2"}}
-
Retreive time series values of an ad hoc formula and mapped values to specific text (e.g. to display flags as annotation colours)
XML{"formula":{"formula":"[this].Flag", "interval":"Hour", "intervalMultiplier":1}, "valueMap":{"9":"Valid", "19":"Missing"}}
-
Note: the tag "exactInterval": true in the above examples is used to roll out the time series values exactly on the interval defined on the time series. If this is not set, the interval is shifted by the start time given by Grafana.
Grafana Variables
Using Tags and the Ad Hoc Filter Variables
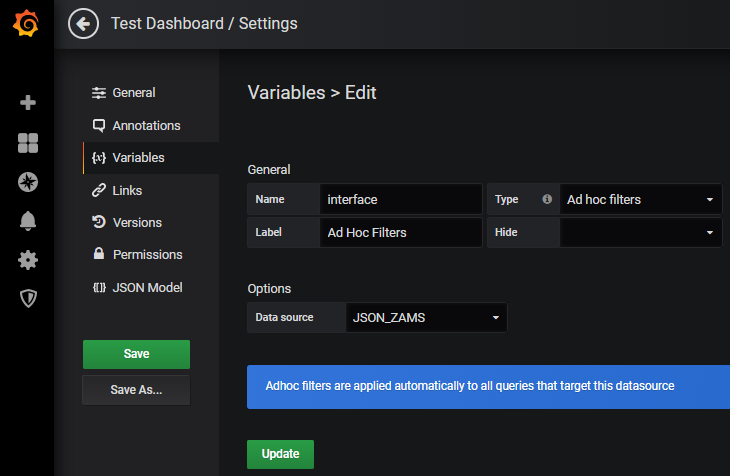
To use tags and ad hoc filters in Grafana, a Grafana variable of the type "Ad hoc filters" must be defined (for each data source). This can be done in the Dashboard Settings - Variables:
An AdHocFilters control is then displayed on the dashboard, where the list of available tags and, next to the comparison operator, the list of available tag values (i.e. distinct values from all time series attribute assignments) are listed:
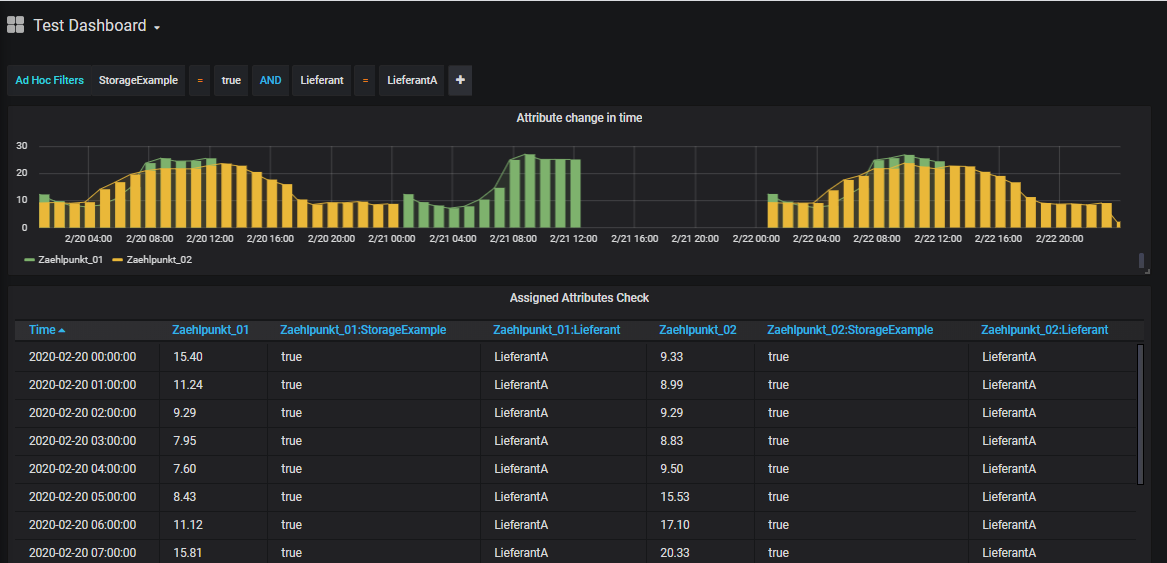
Note: AdHocFilters are applied to all existing data. If time series searches defined in Additional JSON Data are to be extended by further attributes selected in the AdHocFilter, the extendByAdhocFilter:true parameter in the according search section must be configured.
Using Interval Variable
Mit SimPod Json Datasource 0.2.3 (Grafana 7.x) wurde die Unterstützung der Interval Variable temporär deaktiviert und auf den Backlog gesetzt (siehe https://github.com/simPod/GrafanaJsonDatasource/issues/144). Alternativ dazu kann auch eine Custom Variable verwendet werden. Siehe unten.
In Grafana, intervals can be predefined to group time periods according to the selected interval across dashboards.
To use Grafana Interval variables a Grafana variable of type "Interval" with the name "Interval" (or with the name specified in HAKOM.Config "IntervalVariableName") must be defined. If another text is to be displayed instead of "Interval", this can be achieved by using the "Label" field:
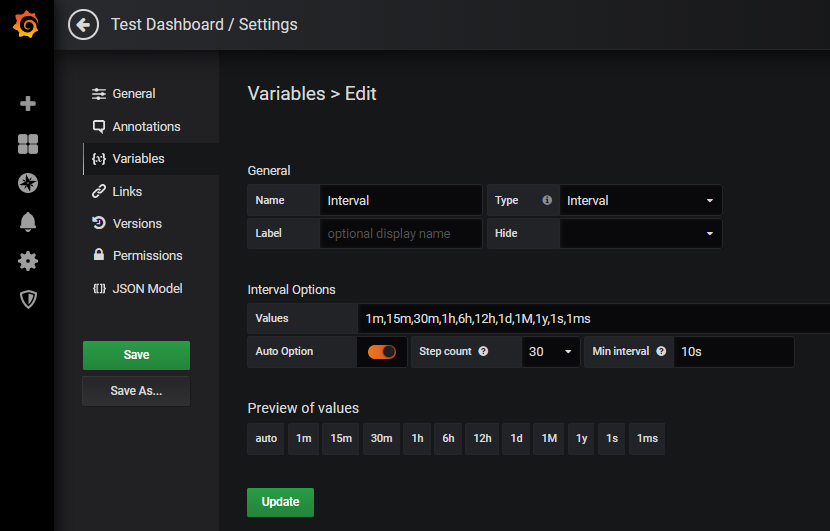
The following interval identifiers are supported:
-
ms: Milliseconds - Example: 1ms
-
s: seconds - Example: 1s
-
m: minute - example: 15m
-
h: hour - example: 1h
-
d: Days - Example: 1d
-
w: weeks - Example: 1w
-
M: months - Example: 1M
-
q: Quarters - Example: 1q
-
y: years - Example: 1y
After configuring the variable, it appears on the dashboard and can be used accordingly:
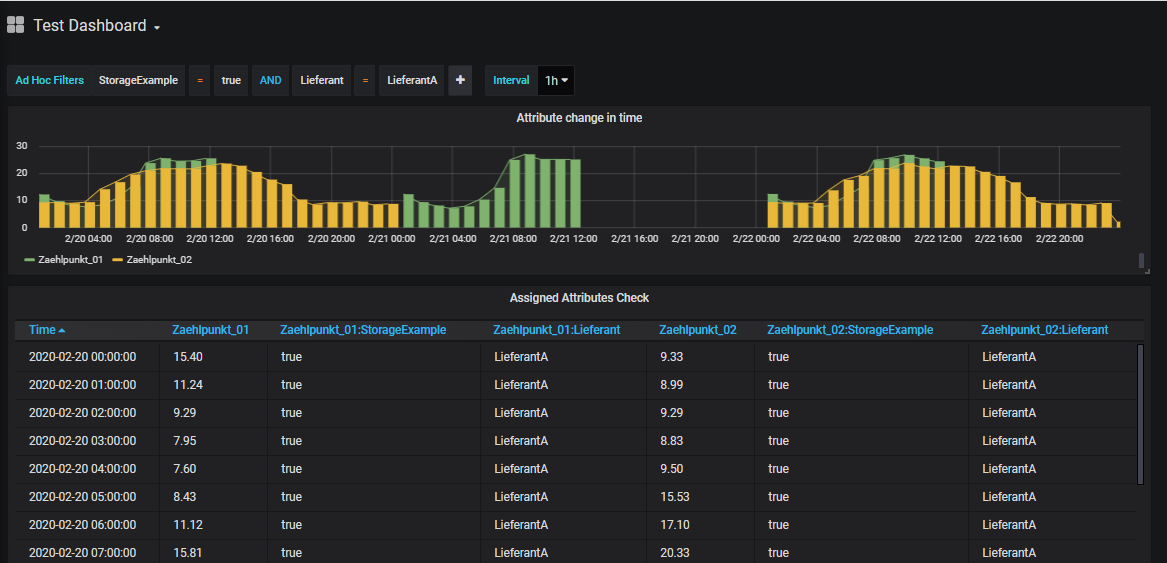
Note: Interval variable overrides the interval calculated by Grafana, but it does not override intervals configured in Additional JSON Data, unless it is explicitely enabled via overrirdeWithGreaterInterval: true.
Using Custom Variable to Simulate Interval Variable
In Grafana 7.x with SimPod 0.2.3, the Interval variable is currently not transmitted via the API. Instead, the variable of type Custom can be used:
For this, a Grafana variable of type "Custom" with the name "Interval" (or with the name specified in HAKOM.Config "IntervalVariableName") must be defined. If another text is to be displayed instead of "Interval", this can be achieved with the help of the "Label" field:
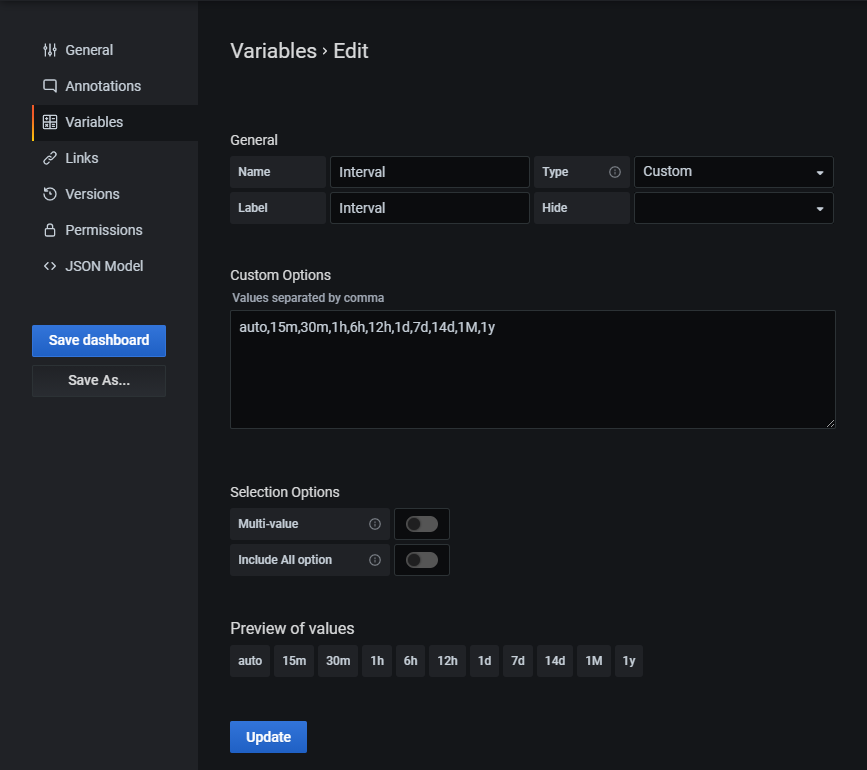
In Cusom Options the same interval names as described above under Interval Variable can be used:
-
ms: Milliseconds - Example: 1ms
-
s: seconds - Example: 1s
-
m: minute - example: 15m
-
h: hour - example: 1h
-
d: Days - Example: 1d
-
w: weeks - Example: 1w
-
M: months - Example: 1M
-
q: Quarters - Example: 1q
-
y: years - Example: 1y
Additionally, the option "auto" can be added (as shown above). This corresponds somewhat restricted to the "Auto Option" of the Interval variable, i.e. if this is selected, the interval suggested by Grafana depending on the selected period is used.
After configuring the variable, it appears on the dashboard and can be used accordingly:
Note: the variable overrides the interval calculated by Grafana, but it does not override intervals configured in Additional JSON Data, unless it is explicitely enabled via overrirdeWithGreaterInterval: true.
Using Text Box and Custom Variable Types in Additional JSON Data
To display additional variables on the dashboard that can be mapped to Additional JSON Data, it is also possible to use text box or custom variable types.
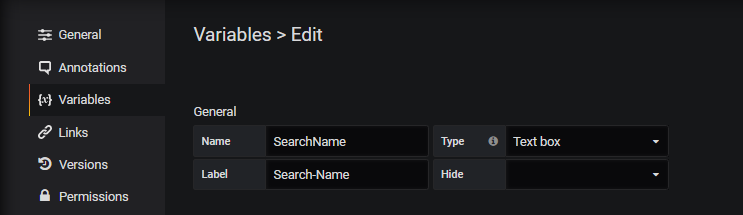
The variable name must currently be inserted between quotes as value in the according Additional JSON Data entry using following pattern: "$VariableName".
Example
To perform a time series search with name, description, etc. via Additional JSON Data entry "search", we create a variable for each time series search parameter:
-
SearchName - Type: Text Box
-
SearchType - Type: Text Box
-
SearchInterval - Type: Text Box
-
SearchDescription - Type: Text Box
-
SearchUnit - Type: Text Box
-
SearchAttributes - Type: Text Box
-
SearchAdvancedAttributeFilter - Type: Text Box
-
SearchextendByAdhocFilter - Type: Custom (without multiple selection), List: true,false
-
ControlExactInterval - Type: Custom (without multiple selection), List: true,false
The variable names can be referenced in Additional JSON Data using quotation marks, each starting with a $ character:
{"exactInterval":"$ControlExactInterval",
 "search": {"name": "$SearchName", "type": "$SearchType",
			"interval": "$SearchInterval","description": "$SearchDescription","unit": "$SearchUnit",
            "attributes": "$SearchAttributes","advancedAttributeFilter":"$SearchAdvancedAttributeFilter",
			"limit": 25,"offset": 0, "extendByAdhocFilter": "$SearchextendByAdhocFilter"}}
Similarly, a TreeNodeSum parameter (both in Standard and Trees Datasource) could also be filled:
{"exactInterval":"$ControlExactInterval",
 "treeNodeSum": {"timeSeriesName": "$SearchName", "attributes": "$SearchAttributes",
			"includeTimeSeries": true
			"limitTimeSeries": 25,"offsetTimeSeries": 0, "extendByAdhocFilter": "$SearchextendByAdhocFilter"}}
Note: for TreeNodeSum the search/filter function of WebTSM Services does not support the properties "interval", "description" and "unit".
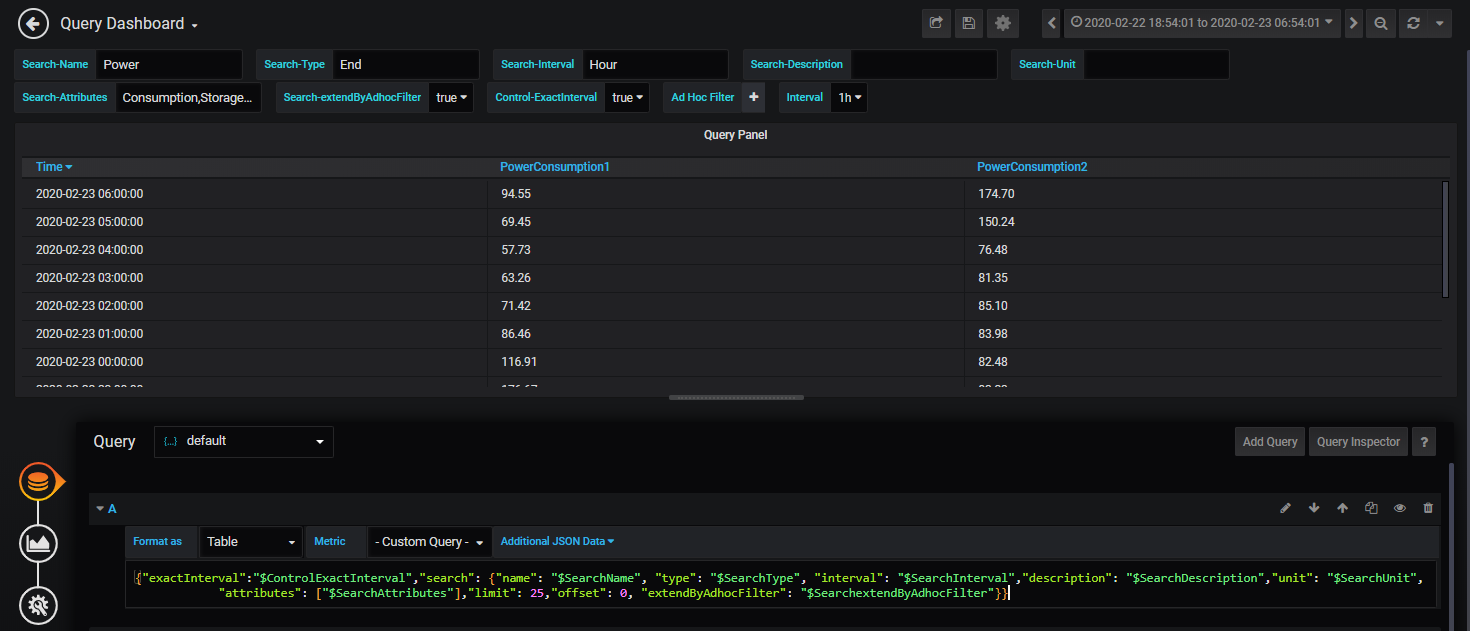
Using the filters in the GUI:
-
Text: can be entered as simple text (e.g.: time series name1)
-
Integer: can be entered as simple text (e.g.: 25)
-
Boolean: can be entered as simple text (e.g. true)
-
Lists: can be entered as comma separated values (e.g. time series name1,time series name2) without space
-
Attributes: see lists, attribute|value pairs can be entered using the pipe '|' separator (e.g.: attribute1|value1,attribute2|value2,attribute3)
-
AdvancedAttributFilter: see lists, attribute+operator+value combinations can easily be written together (e.g. attribute1=value1,attribute2!=value3)
Using Query Variables in Additional JSON Data
Queries allow you to select one or more time series and use them in Additional JSON Data (best in the parameter "timeSeriesNames"). If required, the list can be filtered using regex patterns.
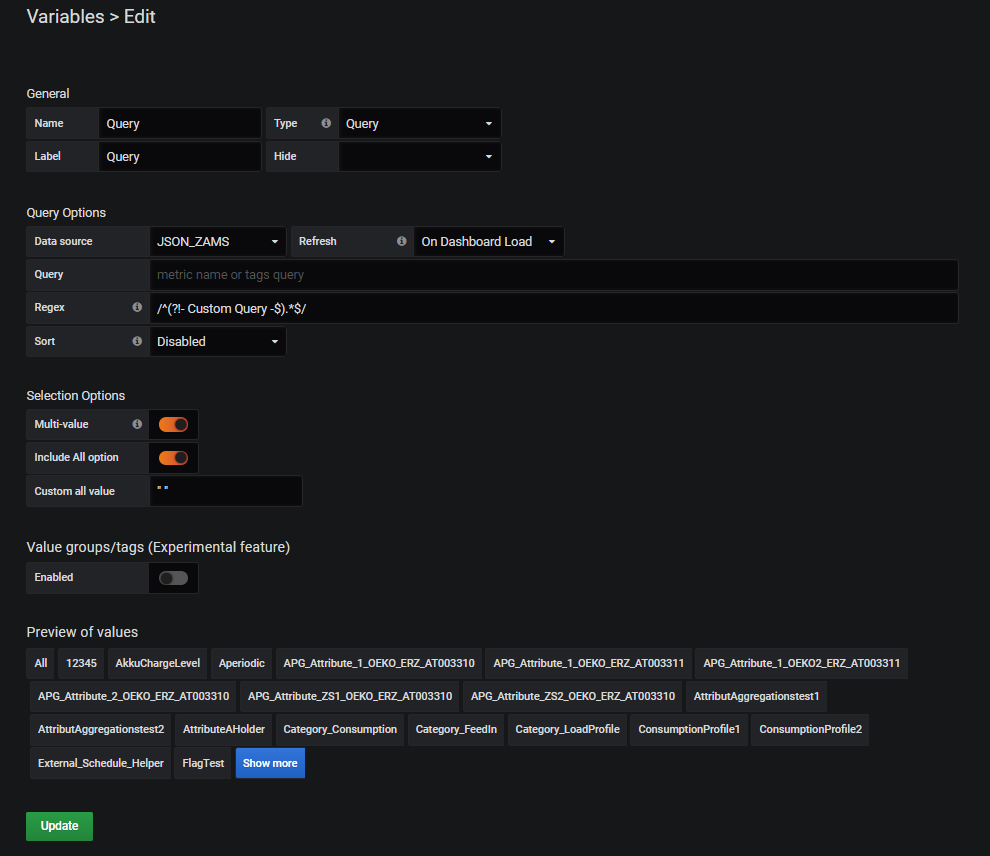
Defining a Query Variable:
Gereral:
-
Name: any
-
Type: Query
-
Label: any
Query Options:
-
Data source: one JSON Data Source
-
Refresh: either "On Dashboard Load" or "On Time Range Change"
-
Query: not supported / used yet
-
Regex: to hide the Custom Query entry ("- Custom Query -") from the time series names query, use the following Regex pattern:
/^(?!- Custom Query -$).*$/
Selection Options:
-
Multi-Value: if several time series are to be selected simultaneously: yes (Attention, multiple selection variables require with JSON Datasource 0.1.7 the HAKOM.Config entry "UseJsonDataSourceQueryFix" = true being enabled, otherwise the interface cannot process the request)
-
Include All option: due to a Grafana bug in some Grafana versions (e.g. 6.4.4) Multi-Value Lists can not be emptied from the dashboard again to no selection. As such clear selection leads to the first entry being selected. If Multi-Value is activated, this option should be activated as well, so that "All" is being displayed as first item, and as such the selection jumps to "All" when the list is emptied. Note: please also read "Custom all value" option below.
-
Custom all value: In combination with "Multi-Value" and "Include All", you can define what the variable should transmit when "All" is selected. By default the complete time series list available from /Search path (i.e. the first 100 entries) is selected. This makes only limited sense. We recommend to use the "Custom all value" to solve the problem described issue regarding unable to empty multi-value list selections. To do this, enter a blank entry, i.e. " " (including quotation marks) here. Because HAKOM TSM does not allow time series with only one " " space, these are automatically filtered out in the search, so that a space entry (contrary to All) does not apply any filtering. If the user wants to list all entries, an empty query can be forced to list all time series with the search parameter "executeEmptySearch".
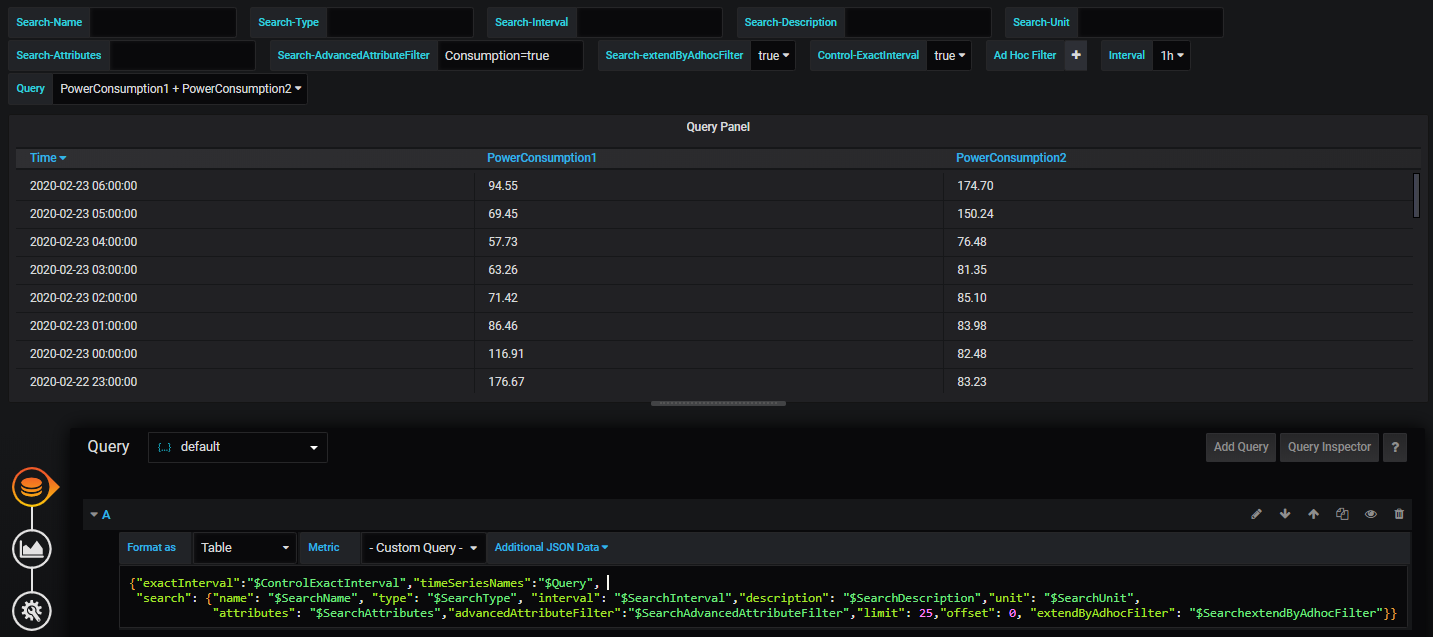
The query variable is best used in "timeSeriesNames" parameter:
{"exactInterval":"$ControlExactInterval","timeSeriesNames":"$Query",
 "search": {"name": "$SearchName", "type": "$SearchType",
			"interval": "$SearchInterval","description": "$SearchDescription","unit": "$SearchUnit",
            "attributes": "$SearchAttributes","advancedAttributeFilter":"$SearchAdvancedAttributeFilter",
			"limit": 25,"offset": 0, "extendByAdhocFilter": "$SearchextendByAdhocFilter"}}