
Configuration of the Extension
The configuration of the extension is done in /HAKOMConfiguration/products/WebTSMServices/Extensions/Grafana area of the HAKOM.Config of the underlying WebTSM service.
General Settings
|
Setting |
Description |
Datatype |
Defaults |
|---|---|---|---|
|
LimitSearchItems |
Maximum number of time series names in the metrics list With Grafana 7.x, the behavior of the metrics list was fundamentally changed so that it is only populated and cached once by Grafana. To use the metrics list in the latest 7.3.7 version, or to edit panels, the default value in HAKOM.Config (until https://github.com/grafana/grafana/issues/30679 was fixed by Grafana) must be set to the maximum number of expected time series. E.g. to 1 million. Warning: this will transfer the complete list of time series names to Grafana at once, this makes the list slow and unresponsive in case many time series are available.
|
integer |
100 |
|
LimitQueryItems |
Maximum number of time series a custom query or TreeNodeSum query may return and visualize. This setting can also be overridden per query. |
integer |
25 |
|
ExactInterval |
Shifts the start of the query period to a round interval start, for example to the exact start of an hour. This setting can also be set per query. |
true/false |
false |
|
ShowFlag |
Displays flags in tables.
This setting can also be set per query. |
None/Name/Id |
None |
|
ShowMissing0AsNaN |
0 values with flag Missing or NoValue can be displayed as Double.NaN instead of 0 using this setting, so that a valid 0 value can be distinguished from missing values on the graphic. |
true/false |
false |
|
IntervalVariableName |
Alternative name for the Grafana variable "Interval". |
string |
Interval |
|
IntervalVariableListSeparator (obsolete) |
Alternative list separator character for JSON and Grafana variable objects. This setting will be removed. Please migrate to ListSeparator entry. |
char |
, |
|
ListSeparator |
Alternative list separator character for JSON and Grafana variable objects. |
char |
, |
|
SearchWildCard |
Configurable wildcard for time series search (repositories/{repository}/search path) |
string |
% |
|
DisplayName |
Default DisplayName definition. See User Guide |
string |
[Name] |
|
AnnotationIsRegion |
Default time format for annotations, which can also be set directly with the annotation parameter "isRegion". |
true/false |
false |
Attribute Settings
|
Setting |
Description |
Datatype |
Defaults |
|---|---|---|---|
|
EnableTags |
Tags / Attribute Search function enabled |
true/false |
true |
|
EnableTagValueSearch |
Tag-Value / Attribute Value Search function enabled |
true/false |
true |
|
ExcludeAttributesFromTags |
Hide individual attributes from the tag search. Example: Attribute1,Attribute2,Attribute100 |
Comma separated list |
|
|
ShowNotMatchingAsNaN |
When tag value searches for attribute values, time series values that lie in the ranges that do not match the search are returned with 0 Missing. Instead of 0, it makes sense to use Double.NaN in timeseries graphics, so that the graphic clearly shows that no values exist for the time range. This setting can also be set per query. |
true/false |
false |
Trees Settings
All tree specific settings are located in a separate <Trees> section.
|
Setting |
Description |
Datatype |
Defaults |
|---|---|---|---|
|
FullNodePathInTags |
Tag values for node attributes display the full tree path to a given node. |
true/false |
true |
|
FullPathInSubNodeName |
In case of node aggregates Grafana objects (time series / table columns) display the full tree path to a given subnode. |
true/false |
true |
|
IdNodePathInSubNodeName |
In case of node aggregates Grafana objects (time series / table columns) display the id of a given subnode. |
true/false |
true |
|
IncludeSum |
Controls whether for TreeNodeSum Aggregates the sum of the selected node / subnode is displayed |
true/false |
true |
|
IncludeTimeSeries |
Controls whether for TreeNodeSum aggregates the time series in the selected node / subnode are displayed. |
true/false |
false |
|
NodeIdMarker |
Trees are displayed in metrics using the following pattern: AttributeName: {NodeIdMarker}NodeId (path to the node). If the default NodeIdMarker is not practical, it can be changed to another string here. |
string |
@ |
|
IncludeAllRootsSubNodesWhenRootIsSelected |
Controls in builder mode - metrics list - in combination with a tree data source, when zooming out within a hierarchy (from a previously selected and loaded sub node to the root nodes) by selecting a root node, if sub nodes of all other root nodes are shown (true), or only the list of root nodes and the sub nodes within the selected root node are displayed (false). |
true/false |
true |
Fixes for Grafana Issues
|
Setting |
Description |
Datatype |
Defaults |
|---|---|---|---|
|
UseGrafanaAnnotationFixInfiniteEnd |
Grafana Simpod JSON Datasource incorrectly displays the "Region" type with end outside the display area for annotations. This setting is used to adjust the end of an annotation, so that it can be displayed correctly. |
true/false |
true |
|
UseJsonDataSourceQueryFix |
Grafana Simpod JSON Datasource mistakenly includes list variables in \"...\" bracket so that they cannot be automatically deserialized to a list object. This fix solves the problem by putting \". Brackets adjusted. Note: this fix performs the following search and replace functions in the Metrics Request JSON Body for all parameters except "formula" parameter: begin: "[\]" end: \"]" subtext between beginning and end: every \" is replaced with ". New text: [Subtext] Example: --------- Before: "timeSeriesNames":"[\"Name1\",\"Name2\"]" After: "timeSeriesNames":["Name1", "Name2"]
|
true/false |
true |
|
UseJsonDataSourceVariableReplaceFix |
Grafana SimPod JSON data source replaces Grafana variables from version 0.1.7. Before that, the variables had to be parsed and replaced in the extension. To deactivate the variable value replacement function, which is obsolete as of 0.1.7, this setting can be set to "false". Note with SimPod JSON data source 0.5.0 and 0.6.0 Grafana query variables are mistakenly removed by the data source plugin, hence a different Query Variable Marker must be used (see Setting QueryVariableMarker), wich will be correctly replaced, if this replace fix setting is enabled. |
true/false |
true |
|
QueryVariableMarker |
Alternative query variable marker to be used to mark query variables, so that if UseJsonDataSourceVariableReplaceFix is enabled, such variables can be correctly replaced by the corresponding values. |
char |
§ |
Configuration Example
<HAKOMConfiguration>
    <products>
        <WebTSMServices>
            ...
            <Extensions>
                ...
                <Grafana>
					<!-- Limit search items for same keyword (default: 100) -->
					<LimitSearchItems>100</LimitSearchItems>
					<!-- Grafana has issues in displaying Attributes (Annotations) when their to date is in the infinite future, to fix this the system will use annotation display range end + some seconds (default: true) -->
					<UseGrafanaAnnotationFixInfiniteEnd>true</UseGrafanaAnnotationFixInfiniteEnd>
					<!-- exactInterval default (default: false)-->
					<ExactInterval>false</ExactInterval>
					<!-- show flags in tables default. Possible entries: None (Flags not shown), Id (Flags shown as Id), Name (Flags shown as Name) (default: None)-->
					<ShowFlag>None</ShowFlag>
					<!-- enable tags: due to performance when loading large number of attributes, tags can be disabled (=false) (default: true) -->
					<EnableTags>true</EnableTags>
					<!-- enable tags: due to performance when loading large number of attributes, tags can be disabled (=false) (default: true) -->
					<EnableTagValueSearch>true</EnableTagValueSearch>
					<!-- to limit the list of attributes available in tags, enter here the names of attributes to be excluded as comma separated values (default: empty)-->
					<ExcludeAttributesFromTags>true</ExcludeAttributesFromTags>
					<!-- to limit number of items returned by a custom query if limit is not specified - (default: 25)-->
					<LimitQueryItems>25</LimitQueryItems>
					<!-- Show time series values if corresponding range does not match AdHoc Query attribute values as double.NaN instead of 0. (default: false)-->
					<ShowNotMatchingAsNaN>false</ShowNotMatchingAsNaN>
					<!-- Show 0 time series values with flag missing or NoValue as double.NaN instead of 0. (default: false)-->
					<ShowMissing0AsNaN>false</ShowMissing0AsNaN>
					<!-- Name of the Grafana Variable type Interval that will be used for Interval filtering (default: Interval)-->
					<IntervalVariableName>Interval</IntervalVariableName>
					<!-- Separator character for Lists in JSON and Variable objects (default: ,)-->
					<ListSeparator>,</ListSeparator>
					<!-- Enable JSON Datasource fix for Query Variables adding to many quotes (default: true)-->
					<UseJsonDataSourceArrrayVariableFix>true</UseJsonDataSourceArrrayVariableFix>
					<!-- Disable JSON Datasource Variable replacement, which is obsolete from JSON Datasource 0.1.7 (default: true)-->
					<UseJsonDataSourceVariableReplaceFix>true</UseJsonDataSourceVariableReplaceFix>
					<!-- Alternative Query Variable Marker (default: §)-->
					<QueryVariableMarker>§</QueryVariableMarker>
					<!-- Trees config -->
		  			<Trees>
			  			<!-- Tag values for node attributes display the full tree path to a given node. (default: true) -->
			  			<FullNodePathInTags>true</FullNodePathInTags>
			  			<!-- In case of node aggregates Grafana objects (time series / table columns) display the full tree path to a given subnode. (default: true) -->
			  			<FullPathInSubNodeName>true</FullPathInSubNodeName>
			  			<!-- In case of node aggregates Grafana objects (time series / table columns) display the id of a given subnode. (default: true) -->
			  			<IdNodePathInSubNodeName>true</IdNodePathInSubNodeName>
			  			<!-- Include Sum default value -->
			  			<IncludeSum>true</IncludeSum>
			  			<!-- Include Time Series default value -->
			  			<IncludeTimeSeries>false</IncludeTimeSeries>
			  			<!-- NodeId Marker for Trees data source -->
			  			<NodeIdMarker>@</NodeIdMarker>
		  			</Trees>
                </Grafana>
            </Extensions>
        </WebTSMServices>
    </products>
<HAKOMConfiguration>
Configuration of Data Sources in Grafana
Standard Data Source
At least one JSON data source must be added for a given HAKOM TSM repository via Configuration - Data Sources - Add data source - JSON (JSON over HTTP data source). If several repositories shall be included, you have to configure a separate JSON data source for each repository.
-
URL: The path must follow the following pattern: {host}/extensions/grafana/repositories/{repository}
Example: http://localhost:20200/api/extensions/grafana/repositories/TSM -
Access: Server or, if Grafana Service has no direct access to the HAKOM WebTSM Services, Browser
-
Auth: Basic auth is currently supported by JSON Data Source, OAuth is only experimental
-
Other: Default edit mode: enable Builder mode to use it as default query editor
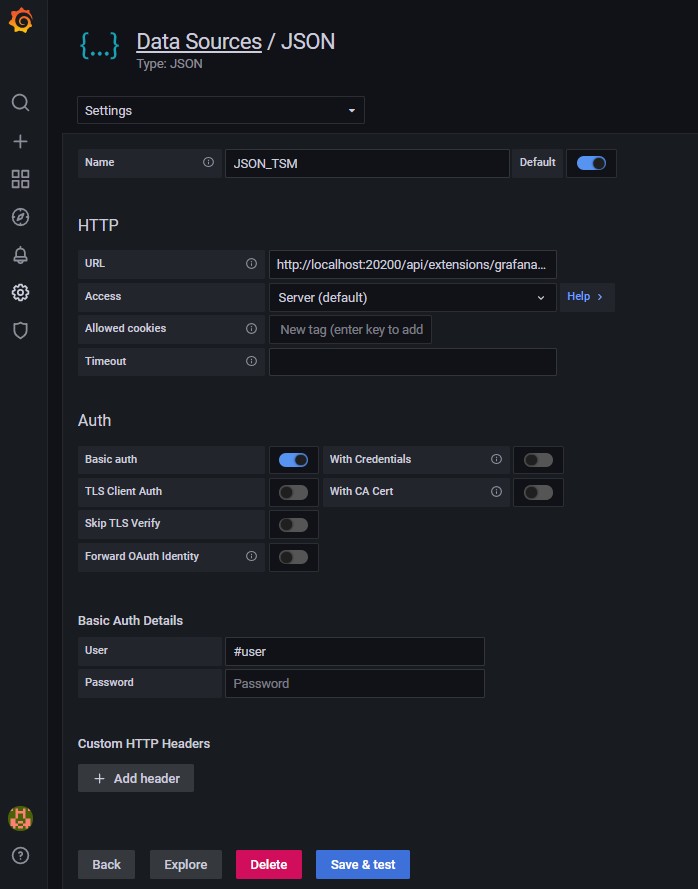
The data source is now configured and can be used in any Grafana panel.
Trees Data Source
In order to select node structures as Grafana Metrics (in graphic panels) in a user-friendly way, all Grafana Extension endpoints are also available under {host}/extensions/grafana/repositories/{repository}/trees.
The configuration is identical to the standard Datasource, only at the end of the URL "/trees" must be inserted after the repository.
Example: http://localhost:20200/api/extensions/grafana/repositories/TSM/trees