
User Guide
Contents
Preparation
For information regarding the installation of the Grafana extension please refer to: Installation of Grafana
Details regarding the configuration of the extension may be found here: Configuration of Grafana
Grafana data sources
The HAKOM Time Series Grafana Extension provides the following two data source endpoints:
- Standard data source: a generic data source for all time series tasks. In panels and all queries around Grafana Metrics HAKOM time series are queried / listed
- Trees data source: a node attribute aggregation data source, specifically designed for Trees. In panels and all queries around Grafana Metrics HAKOM Trees are queried / listed. Node attributes are rolled out flat, i.e. main nodes and all subnodes are listed as single entries.
Metric Builder Mode
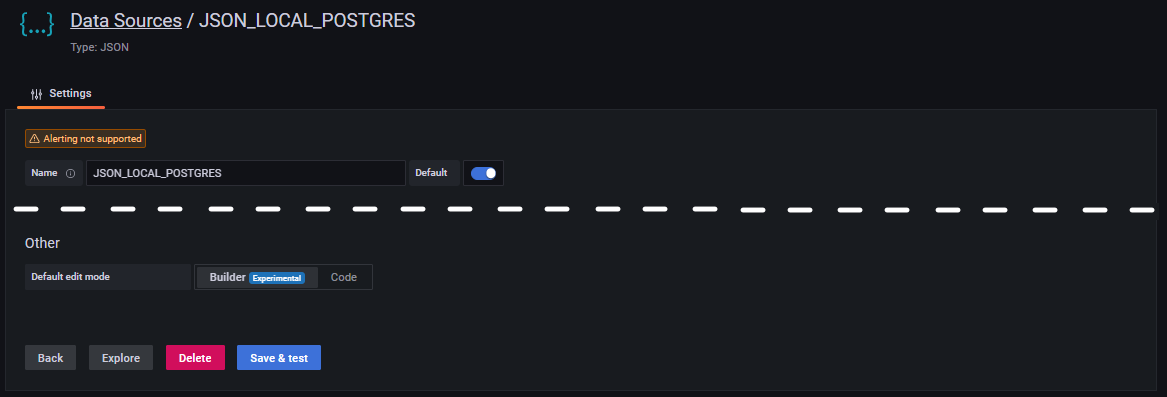
Note: with SimPod JSON Datasoruce version 0.6.0 a new Builder Mode has been introduced, that provides a user oriented metric query interface. In order to enable it for a given data source as default, select "Default edit mode" to "Builder" in the "Other" section of the data source configuration:
HAKOM Time Series in Grafana
Panels
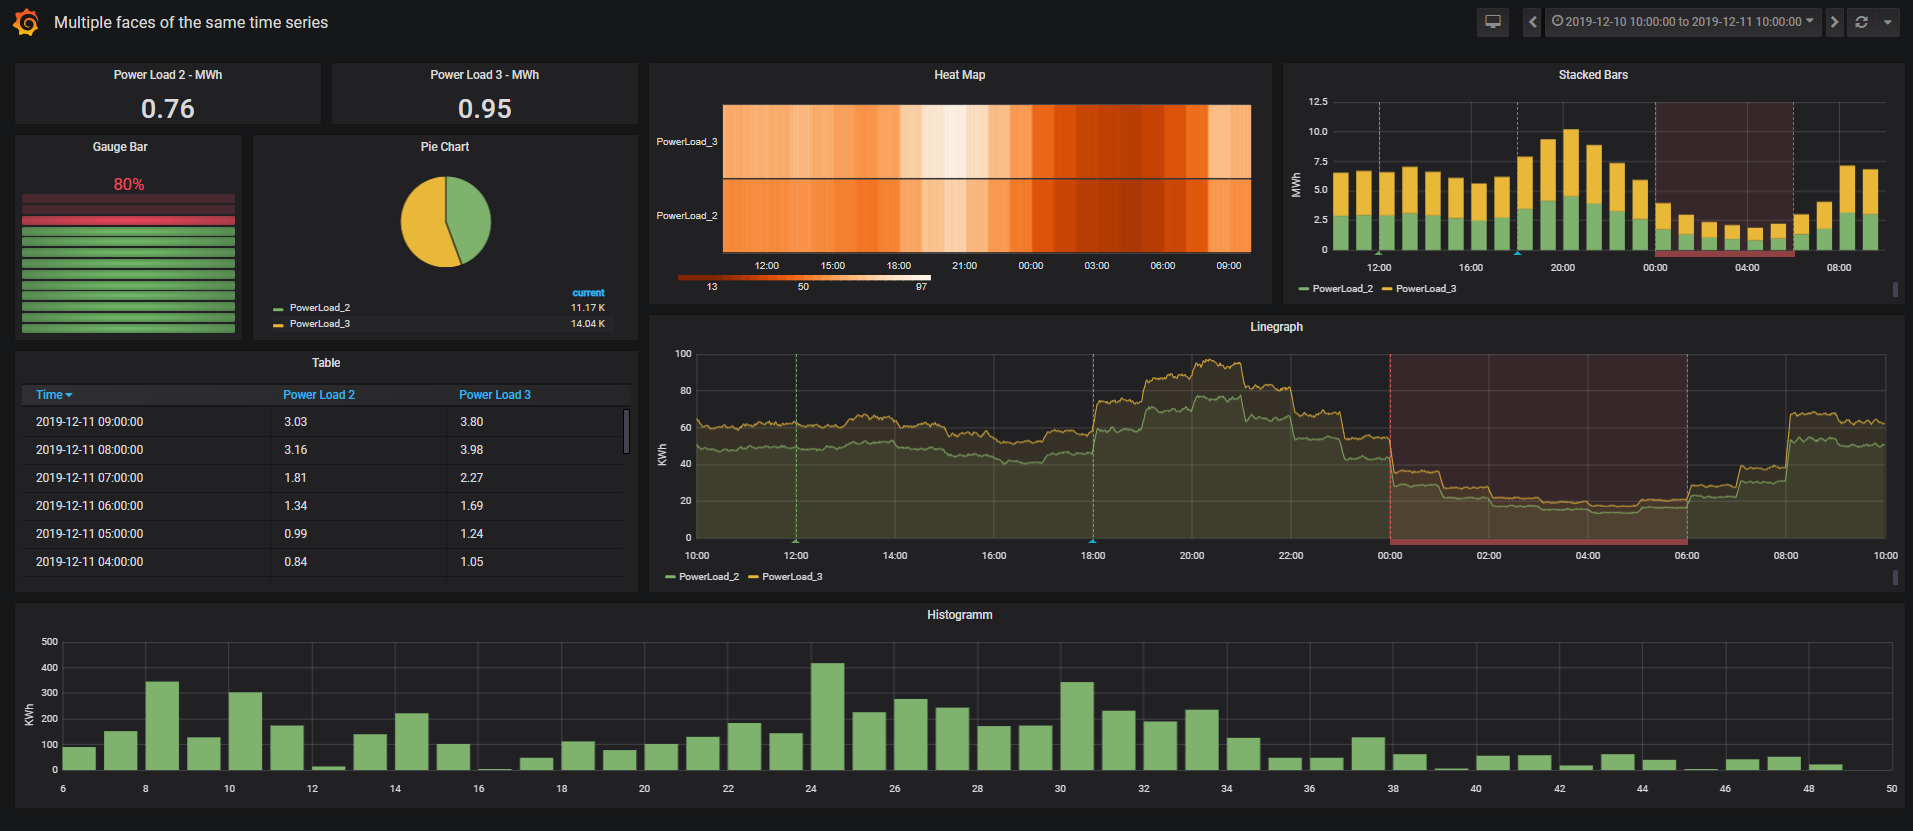
In Grafana data is organized in dashboards, where each dashboard can contain one or multiple visualization panels and each panel can display several time series from the same data source. Hence to visualize time series, create a new dashboard with an empty panel at first.
Adding time series to a panel
Standard data source
To add time series to a panel follow the below steps:
- Go to tab Query
- Select a configured (SimPod JSON) Data source
- Select a Metric:
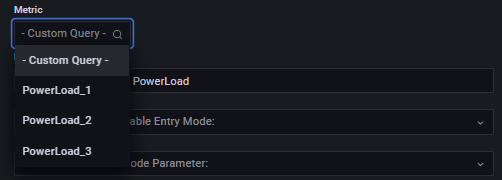
by either selecting the desired time series name from the Metric list
Filtering Metric list
Note: the Metric list is limited to the first 100 time series names (this can be extended using HAKOM.Config > products > WebTSMServices > Extensions > Grafana > LimitSearchItems).
With Grafana 9.x / SimPod JSON Datasource 0.6.0 - Builder mode, the Metric list can be refreshed and filtered using the "Metric > Metric Filter:" input box:
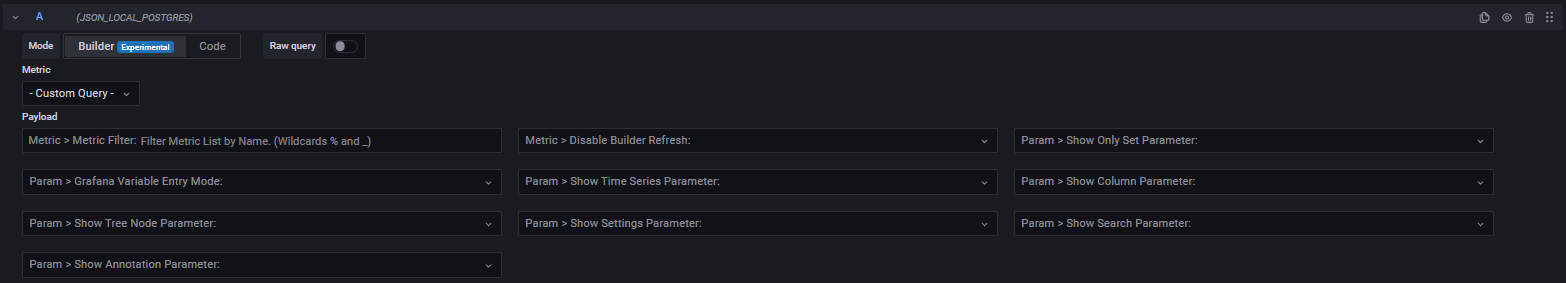
1. Switch to Builder mode (if not already enabled)
2. Select the first Metric (- Custom Query -) to display Builder UI parameter
3. Enter some characters in the "Metric > Metric Filter:" input box and click outside the box.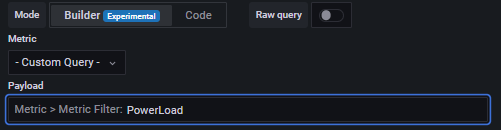
4. The metric list is now being refreshed and filtered by the entered string:
- Or by selecting - Custom Query - to conduct a custom time series search using the Payload section (see Builder Parameter / Payload).
After selecting a time series its data will be immediately displayed in the graph.
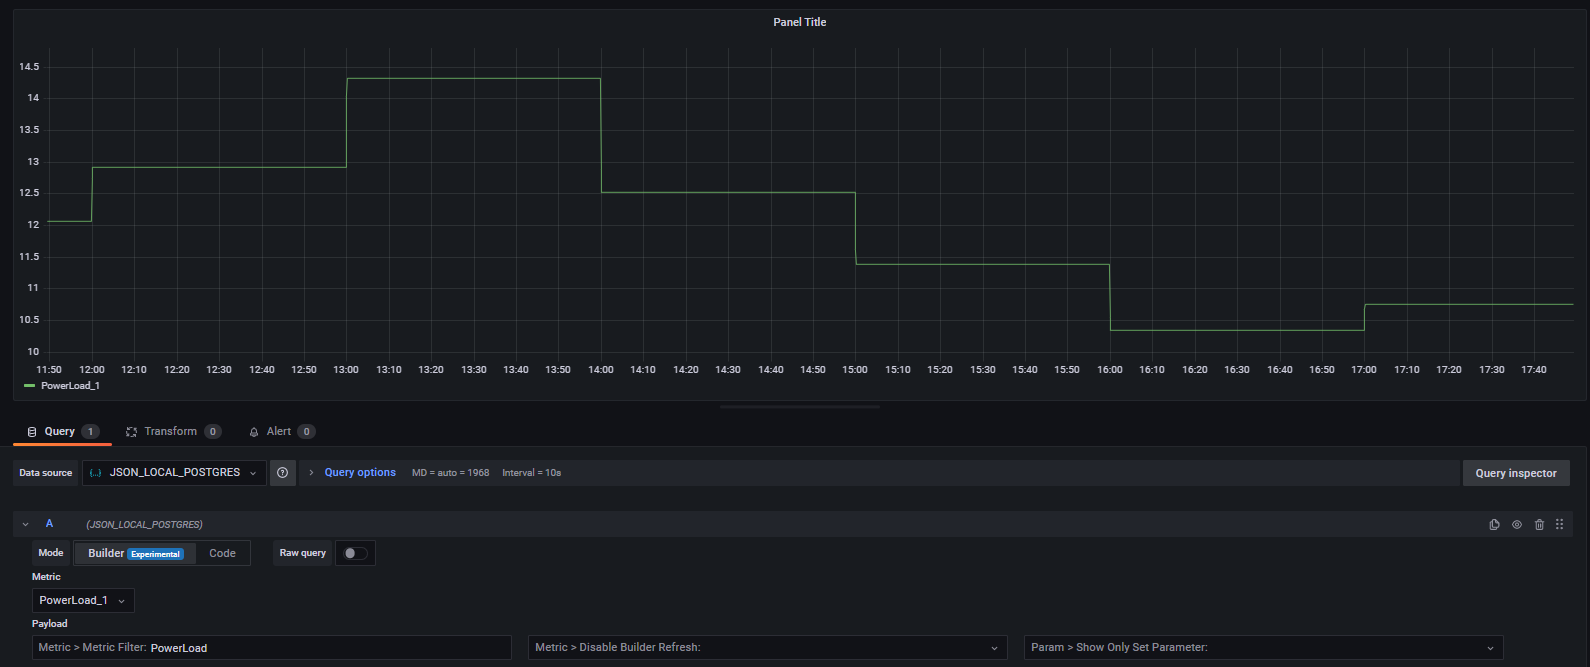
Finally, further parameters can be configured using Payload parameter (either using the Builder mode or by entering the according parameters via Code mode). See also Builder Parameter / Payload.
Payload section
Note: Prior to Grafana 8.0 / SimPod 0.3.0 the field "Payload" was named Additional JSON Data.When migrating dashboards to 8.0, the Additional JSON Data content must be transferred to the new Payload field!
Trees data source
Node aggregates in trees data source can be added in the following simple steps:
- Select Query datasource (e.g. JSON_DOCKER_POSGRE)
- Metric: Select the desired tree node, and set unit via Payload field if necessary.
Finally, further parameters can be configured using Payload field. See also Builder Parameter / Payload.
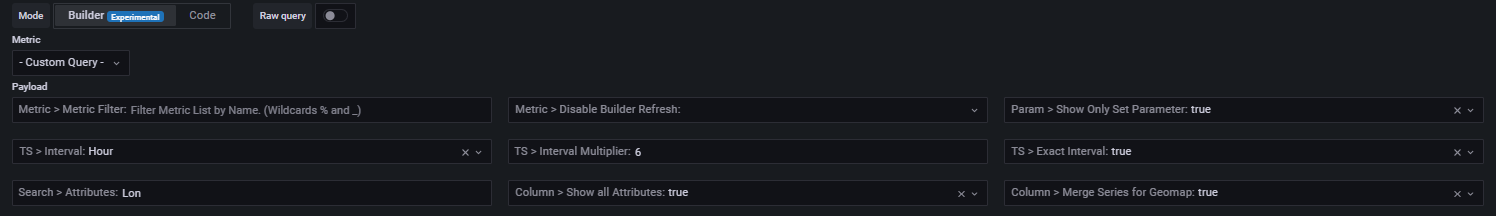
Builder mode vs. Code mode
With Grafana 9.x and SimPod JSON Datasource 0.6.0 a new metric Builder mode has been added. The Builder mode can be used to intuitively browse through all available HAKOM Time Series Grafana parameters. In order to enable Builder mode parameters, select Builder in the Mode section and either select - Custom Query - or any time series name in the Metric list:
Alternatively a JSON Payload can be still provided using Code mode.
Entering relative date patterns
In all date time parameters (such as audit, quotation, search effective attribute from and search effective attribute to dates) besides empty value (no date), and ISO 8601 date, a relative date time pattern can be also entered. To add relative calculated dates, use the following pattern: <ref-date><relative-date-modifiers>
<relative-date-modifiers> can be: none, one or multiple set of <operator><n><date-unit> modifiers chained together.
List of supported <operator>:
| Operator | Meaning | Effect |
|---|---|---|
| + | plus | add n date-units to date |
| - | minus | substract n date-units to date |
| ~ | set | set specified date-unit to n, keeping all other date-units |
| | | abs | set specified date-unit to n, setting all smaller units to their start (e.g. 1. day of month or 0 hour) |
| [ | round down | round down to specified number of date-units |
| ] | round up | round up to specified number of date-units |
List of supported <date-unit>:
| Date unit | Meaning |
|---|---|
| f | milliseconds |
| s | seconds |
| m | minutes |
| h | hours |
| d | days |
| w | weeks |
| M | months |
| y | years |
Supported <ref-date>:
| Ref Date | Meaning |
|---|---|
| Any ISO 8601 Date | The given ISO date will be used as reference date for further relative date calculation |
| today | Todays date (without time) will be used as reference date for further relative date calculation |
| now | Now time stamp will be used as reference date for further relative date calculation |
Examples:
| Operator | Example | Effect |
|---|---|---|
| ref date ISO date | 2021-08-20T23:00:00Z | 2021-08-20T23:00:00Z |
| ref date today | today | todays date (e.g. 2021-08-20) |
| ref date now | now | current time stamp (e.g. 2021-08-20T12:16:23Z) |
| abs | 2021-08-20T23:00:00Z|1d | first of the month 0 hour 2021-07-31T23:00:00Z |
| set | 2021-08-20T23:15:00Z~1d | first of the month same hour 2021-08-01T23:15:00Z |
| plus | 2021-08-20T23:15:00Z+1d | plus one day 2021-08-21T23:15:00Z |
| round down | 2021-08-20TT23:17:28Z[15m | previous whole 15 min. 2021-08-20T23:15:00Z |
| chained operators | now[15m-15m | whole 15 min. before or equal to now minus 15 min. |
Builder parameter / Payload
The following tables show lists of parameter available in Builder mode and in Code mode Payload section. Column "Parameter name" shows the name of the parameter in Builder mode, column "Code / Legacy Code" property name used in the Payload (visible if Mode is set to Code) section. To use the parameter in the Payload, use the following pattern: "Code": "value". For example to add the parameter searchNames with a list of time series: "searchNames": "time series name 1,time series name 2".
The second code is shown in "Code / Legacy Code" column (if applicable), shows the old Payload name of the property, which is still supported, but cannot be assigned to builder parameter and should be migrated to the name shown in Code column.
Builder Control Parameter
| Parameter name | Description | Code / Legacy Code | Content | Example | Default |
|---|---|---|---|---|---|
| Metric > Metric Filter | Filters the Metric list with the given characters. Use this to refresh and filter Metric list. | metricsFilter | string | My time ser | |
| Metric > Disable Builder Refresh | While this option is set to true, Metric and Builder controls are not refreshed. Use this control to tempararily disable refreshing the Builder, e.g. in case several search parameters need to be entered prior to executing the search parameter. Once all parameter have been defined, don't forget to enable Builder refresh again. | disableRefresh | true / false | true | false |
| Param > Show Only Set Parameter | Use this option to display only Builder parameter that have been set. This can be helpful, to get an overview, if several parameters from different sections are set. | showOnlySetParameter | true / false | true | false |
| Param > Grafana Variable Entry Mode | Use this option to switch all list parameters to input controls, so that Grafana Variable names can be entered, instead of selecting an item from the given list. | enableVariableMode | true / false | true | false |
| Param > Show Time Series Parameter | If enabled all time series data control parameter (such as interval, formula, aggregation, audit, quotation etc.) are displayed. See chapter Time Series Parameter. | showTimeSeriesParameter | true / false | true | false |
| Param > Show Column Parameter | If enabled table column specific control parameter (such as list of attributes to be displayed, columns merge mode for Geomap plugin, or show flags switch) are displayed. See chapter Column Parameter. | showColumnParameter | true / false | true | false |
| Param > Show Tree Node Parameter | If enabled tree node sum specific control parameter (such as tree name, node id, sum type etc.) are displayed. See chapter Tree Node Parameter. | showTreeParameter | true / false | true | false |
| Param > Show Settings Parameter | If enabled additional settings control parameter (such as override with greater interval, display not matching attribute search results as NaN) are displayed. See chapter Settings Parameter. | showSettingsParameter | true / false | true | false |
| Param > Show Search Parameter | If enabled and - Custom Query - is selected as Metric additional time series search parameter (such as names, attributes, type etc.) are displayed. See chapter Search Parameter. | showSearchParameter | true / false | true | false |
| Param > Show Annotation Parameter | If enabled additional annotation parameter (such as annotation time series, annotation is region, value filter, value map) are displayed. See chapter Annotation Parameter. | showAnnotationParameter | true / false | true | false |
Time Series Parameter
| Parameter name | Description | Code / Legacy Code | Content | Example | Default |
|---|---|---|---|---|---|
| TS > Display Name | Alternative display name for time series. Using this parameter the name of the time series can be replaced by a combination of fixed string components and time series properties. Syntax: use the following pattern to enter display names: Free text +[TS Property]+ Free text + [TS Property 2] Restrictions: For AdHoc formula time series (see parameter "formula") only the time series name (component [Name]) can be selected from the underlying calculation template. Other properties of the calculation template time series are not accessible. If the parameter "formulaAlias" is used, it will not be overwritten by the parameter "displayName". For node aggregates (see the "TreeNodeSum" parameter), the "displayName" is applied only to the time series if included in the result (using treeNodeSumIncludeTimeSeries parameter) but not on the nodes. | displayName |
| ||
| TS > Interval | Interval (see WebTSM Service /intervals - e.g.: Second, Minute, Hour, etc. ) - if specified, the interval provided by Grafana is not used. If Grafana Variable Entry Mode is off, a list of supported intervals is enlisted in Builder mode. | interval | string or Int | Hour | |
| TS > Interval Multiplier | Interval multiplier, if interval is specified and interval multiplier is not set, the default value is used. | intervalMultiplier | int | 15 | 1 |
| TS > Exact Interval | If set to true, the query period is automatically rounded to the previous exact start of a time series' interval. I.e. with an interval of one hour and a query start time of 13:46, the query will be rounded down to 13:00. This allows values of time series to be queried in intervals. The default value can be defined in HAKOM.Config > products > WebTSMSErvices > Extension > Grafana > ExactInterval. | exactInterval | true / false | true | false |
| TS > Unit | Unit to convert queried data (not used for formula). If Grafana Variable Entry Mode is off, a list of supported units is enlisted in Builder mode. | unit | Any valid unit | MWh | |
| TS > Audit | Audit date to be used to queried data. Relative dates are supported - see chapter Entering relative date patterns. | audit | ISO date or relative date pattern | 2021-08-20 today+1d | |
| TS > Exact Audit | Specifies whether exact audit shall be used. If true only changes exactly on given audit time stamp are returned. | exactAudit | true / false | true | false |
| TS > Quotation | Quotation date to be used to queried data. Relative dates are supported - see chapter Entering relative date patterns. | quotation | ISO date or relative date pattern | 2021-08-20 today+1d | |
| TS > Exact Quotation | Specifies whether exact quotation shall be used. If true only changes exactly on given quotation time stamp are returned. | exactQuotation | true / false | true | false |
| TS > Aggregation | Aggregation rule for time series data (see WebTSM Service /aggregations endpoint. Examples: Sum, Average, Max, Min, MostFrequently, etc.). If Grafana Variable Entry Mode is off, a list of supported aggregations is enlisted in Builder mode. | aggregation | string | Sum | |
| TS > Formula | Formula - if specified, an ad hoc formula calculation is performed analog to the TSM plugin - where [this] and [this,...] blocks are replaced with the corresponding selected time series name. Attention: [this] reference should not be used with - Custom Query - because that time series does not exist. | formula | string | [TimeSeriesName]*[this] | |
| TS > Formula Alias | Per default, Grafana displays the selected time series name, in case of an ad hoc formula is used. To use a custom name instead, use this parameter. | formulaAlias | string | My formula result name |
Column Parameter
Migration hint
Note: Column parameter were located under "columns" property in pre Builder mode releases e.g. "columns": {"allAttributes": true}. Although the "columns" property is still supported, the Builder mode cannot map it to the builder variables. Each old property name within columns can (should) be directly referenced as columnsOldPropertyName. E.g. "columns": {"allAttributes": true} → "columnsAllAttributes": true.
To get a migrated payload, post the old payload to the baseUrl/extensions/grafana/payloadconverter endpoint. See chapter Payload Converter.
| Parameter name | Description | Code / Legacy Code | Content | Example | Default |
|---|---|---|---|---|---|
| Column > Show all Attributes | If true, all attributes of the selected time series are loaded. | columnsAllAttributes columns { allAttributes } | true / false | ||
| Column > Custom List of Attributes | An exact list of attributes loaded as additional columns (if given attributes assigned to the time series). Note: By default, it is not possible to use commas in the attribute name due to the list separator. The default separator can be defined HAKOM.Config > products > WebTSMServices > Extension > Grafana > ListSeparator → but note this will effect all other list entries as well. | columnsCustomList columns { customList } | list of strings | ["Attribute1","Attribute2"] Short: Attribute1,Attribute2 | |
| Column > Source Time Series for Attributes | Time series name the attributes to be load for. If this is set, no attributes are loaded for other time series. | columnsSourceTimeseries columns { sourceTimeseries } | TimeSeries1 | ||
| Column > Merge Series for Geomap | To use multiple time series data in geomap plugin, set this parameter to true. Note: Geomap plugin supports time series tables containing one time stamp, one value column, and one lon and lat column. Where each time stamp can be repeated for any given lon/lat combinations. This parameter will merge multiple time series columns to one value column, with different lon and lat values. | columnsMerge | true / false | true | false |
| Column > Don't display TS Name in Attribute Column | If true, time series names in attribute columns resulting from columnsSourceTimeseries are not displayed, but only the name of the given attributes. | columnsNoTimeseriesNameInAttributeHeader columns { noTimeseriesNameInAttributeHeader } | true | ||
| Column > Show Flag | If set to "Id" the flags id is output, if set to "Name" flag names are output, if not specified or set to "None" no flags are output. The default value can be defined in HAKOM.Config > products > WebTSMServices > Extension > Grafana > ShowFlag. If Grafana Variable Entry Mode is off, a list of supported show flag options is enlisted in Builder mode. | columnsShowFlag columns { showFlag } | Name | None |
Tree Node Parameter
Migration hint
Note: Tree node parameter were located under "treeNodeSum" property in pre Builder mode releases e.g. "treeNodeSum": {"nodeId": 1}. Although the "treeNodeSum" property is still supported, the Builder mode cannot map it to the builder variables. Each old property name within columns can (should) be directly referenced as treeNodeSumOldPropertyName. E.g. "treeNodeSum": {"nodeId": 1} → "treeNodeSumNodeId": 1.
To get a migrated payload, post the old payload to the baseUrl/extensions/grafana/payloadconverter endpoint. See chapter Payload Converter.
| Parameter name | Description | Code / Legacy Code | Content | Example | Default |
|---|---|---|---|---|---|
| Trees > Tree Name | Name of the tree (Attribute node) to be displayed / aggregated. Attention: The name must always be specified for Standard data source. For Trees data source the name is being set automatically from the selected metric. | treeNodeSumName treeNodeSum { name } | MyTreeAttribute | ||
| Trees > Tree Node Id | Id of a node, which is to be displayed / aggregated. Note the Id = 0 always leads to the main node and can be omitted. Note: For Trees data source the nodeId is being set automatically. | treeNodeSumNodeId treeNodeSum { nodeId } | 10 | ||
| Trees > Sum Type | Controls whether time series from subnodes inside the given node or only from the selected node are displayed / aggregated.
If Grafana Variable Entry Mode is off, a list of supported sumTypes is enlisted in Builder mode. | treeNodeSumSumType treeNodeSum { sumType } | ExcludingSubNodes | ||
| Trees > Attribute Filter | List of attributes, or attribute name|value pairs as array. The result is a standard time series search with attributes. All time series values of the found time series are displayed, even in time ranges, where the given attribute-value search would not return a match. Note: By default, it is not possible to use commas in the attribute name or value due to the list separator. The default separator can be defined HAKOM.Config > products > WebTSMServices > Extension > Grafana > ListSeparator → but note this will effect all other list entries as well. | treeNodeSumAttributes treeNodeSum { attributes } | ["attributeName1|Value1", Short: attributeName1|Value1, | ||
| Trees > Time Series Name Filter | Search string for time series names. At the end of the search string, the framework assumes a wildcard search character defined in the framework. To use wildcards within the search string, use the configured wild card character (by default: %). | treeNodeSumTimeSeriesName treeNodeSum { timeSeriesName } | MyTimeSeries_ | ||
| Trees > Calculate Sums | Calculates and returns the sum of each tree node in the result. | treeNodeSumIncludeSum treeNodeSum { includeSum } | true | false | |
| Trees > Include Time Series Definitions | Includes time series in the result. | treeNodeSumIncludeTimeSeries treeNodeSum { includeTimeSeries } | true | false | |
| Trees > Include Sub Nodes | Includes sub-nodes within the selected node(s) in the result. | treeNodeSumIncludeSubNodes treeNodeSum { includeSubNodes } | true | false | |
| Trees > Extend Results by Ad Hoc Filter | Controls whether the node selection is delegated to the Grafana AdHocFilter variable (true), or only the node defined in the treeNodeSum is taken into account (false). If true, a sub-node selected in the AdHocFilter is used as nodeId (in case AdHocFilter operator is "="). Attention: if a treeNodeSumNodeId was defined, it will be overridden by the AdHocFilter. | treeNodeSumExtendByAdhocFilter treeNodeSum { extendByAdhocFilter } | true | false | |
| Trees > Limit | Limits the number of time series if treeNodeSumIncludeTimeSeries is true. The default value can be defined in HAKOM.Config > products > WebTSMServices > Extension > Grafana > LimitQueryItems. | treeNodeSumLimitTimeSeries treeNodeSum { limitTimeSeries } | 25 | LimitQueryItems | |
| Trees > Offset | Offset, i.e. start index in combination with the number of time series returned to paginate through a limited number of time series. | treeNodeSumOffsetTimeSeries treeNodeSum { offsetTimeSeries } | 0 |
Settings Parameter
| Parameter name | Description | Code / Legacy Code | Content | Example | Default |
|---|---|---|---|---|---|
| Settings > Override with Greater Interval | If true, defined interval and intervalMultiplier parameter will be overwritten by a Grafana calculated interval or by the Grafana Interval variable, if Grafana intervals are larger (e.g. if interval parameter is set to Hour and Grafana provides interval Day, since Day is larger, it will override the defined Hourly interval parameter. As such interval and intervalMultiplier can be used to define a minimum interval, which can be dynamically overwritten by larger intervals. | overrirdeWithGreaterInterval | true / false | true | false |
| Settings > Show Not Matching Datapoints as NaN | When filtering time series by Attriubtes (AdhocFilter or attribute filter), values of a time series where the filter does not apply are displayed by default as 0 Missing by the service. To display affected time series values as missing in graphical panels, it is possible to overwrite such values with the value "NaN", so that no graphical line is displayed for the given values in graphical panels. Note: time series columns beginning with NaN values in Table metrics might not considered as time series (known Grafana issue). | showNotMatchingAsNaN | true / false | true | false |
| Settings > Show Missing 0 Values as NaN | To show 0 time series values with Missing or NoValue flag as missing in graphical panels, it is possible to overwrite such values with the value "NaN"so that no graphical line is displayed for the given values in graphical panels. Note: time series columns beginning with NaN values in Table metrics might not considered as time series (known Grafana issue). | showMissing0AsNaN | true / false | true | false |
| Settings > Grafana Data Format | As of Grafana 8.0 / SimPod 0.3.0, the field "Format as" has been removed. As such user cannot switch between "timeseries" and "table" formats. Since some Grafana plugins only support "table" format, the system uses "table" format if nothing else specified. To change from "table" to "timeseries" format, this parameter can be used. If Grafana Variable Entry Mode is off, a list of supported formats is enlisted in Builder mode. | targetType | timeseries or table | timeseries | table |
| Settings > Full Tree Path in Sub Node Name | Controls whether the displayed node name (if it represents a sub-node) shows the complete node path to the respective sub-node. The default value can be defined in HAKOM.Config > products > WebTSMServices > Extension > Grafana > FullPathInSubNodeName. | fullPathInSubNodeName | true / false | true | false |
| Settings > Id in Tree Sub Node Name | Controls whether the node id is displayed in the displayed node name (if it represents a sub-node). The default value can be defined in HAKOM.Config > products > WebTSMServices > Extension > Grafana > IdInSubNodeName. | idInSubNodeName | true / false | true | false |
| Settings > Include all other roots' Sub Nodes when Root is selected | Controls in Builder Mode - Metrics list - in combination with a Tree data source, when zooming out within a hierarchy (from a previously selected and loaded sub node to the root nodes) by selecting a root node, if sub nodes of all other root nodes are shown (true), or only the list of root nodes and the sub nodes within the selected root node are displayed (false). The default value can be defined in HAKOM.Config > products > WebTSMServices > Extension > Grafana > IncludeAllRootsSubNodesWhenRootIsSelected. | includeAllRootsSubNodesWhenRootIsSelected | true / false | false | false |
Search Parameter
Are only visible in standard data source (in Trees, use the Tree Node Parameter to search for objects) if - Custom Query - is selected.
Migration hint
Note: Search parameter were located under "search" property in pre Builder mode releases e.g. "search": {"names": "Time Series"}. Although the "search" property is still supported, the Builder mode cannot map it to the builder variables. Each old property name within columns can (should) be directly referenced as searchOldPropertyName. E.g. "search": {"names": "Time Series"} → "searchNames": "Time Series".
Also note, that search > name property has been merged to search > names. Hence please use searchNames instead of search > name.
To get a migrated payload, post the old payload to the baseUrl/extensions/grafana/payloadconverter endpoint. See chapter Payload Converter.
| Parameter name | Description | Code / Legacy Code | Content | Example | Default |
|---|---|---|---|---|---|
| Search > Names List | List of time series names including wildcards to be searched OR linked. Note: If HAKOM.Config > products > HAKOMFramework > settings > TimeSeriesSearchExact setting is true, the search wildcard % must be inserted at the end of the time series name to use wildcard search. Otherwise, only time series with the exact specified name will be found. | searchNames search { names } | list of strings | ["TimeSeries1", "TimeSeries%"] Short: TimeSeries1,TimeSeries% | |
| Search > Type | Type of the time series (see WebTSM Service /timeseriestypes endpoint. Examples: Begin, End, Spontaneous.). If Grafana Variable Entry Mode is off, a list of supported types is enlisted in Builder mode. | searchType search { type} | string: Begin, End, Spontaneous | Begin | |
| Search > Interval | Interval of the time series (see WebTSM Service /intervals - e.g.: Second, Minute, Hour, etc.). If Grafana Variable Entry Mode is off, a list of supported intervals is enlisted in Builder mode. | searchInterval search { interval} | string: supported intervals | Minute | |
| Search > Description | Description of the time series. | searchDescription search { description } | string | TimeSeries Description | |
| Search > Unit | Unit of the time series. If Grafana Variable Entry Mode is off, a list of supported units is enlisted in Builder mode. | searchUnit search { unit} | string | MWh | |
| Search > Attributes | List of attributes, or attribute name|value pairs as array. The result is an extended time series search with attributes, where repeated attribute names are OR connected. On top searchEffectiveAttributeDateFrom and searchEffectiveAttributeDateTo can filter the validity of attribute time slices. In case no effective attribute dates are provided, all time series values of the found time series are displayed, even in time ranges, where the given attribute-value search does not match. Note: By default, it is not possible to use commas in the attribute name or value due to the list separator. The default separator can be defined HAKOM.Config > products > WebTSMServices > Extension > Grafana > ListSeparator → but note this will effect all other list entries as well. | searchAttributes search { attributes } | list of strings | ["attributeName1|Value1", Short: attributeName1|Value1, | |
| Search > Advanced Filter | List of attribute filters with comparison operators:
Note: HAKOM Type operators can be only used in Builder / Code, AdhocFilter Type operators are available in Grafana AdhocFilter variable. The search is only applied to time series where the attribute selected in Key is assigned. I.e. an attributeA!=ValueB filter lists all time series to which attributeA has been assigned a value other than valueB (at least for a timestamp of the display time range). Advanced Attribute Filters are applied to each individual time stamp of the time series. Time stamps (time ranges) where the search does not apply are displayed with 0 (or NaN) Missing. Note: By default, it is not possible to use commas in the attribute name or value due to the list separator. The default separator can be defined HAKOM.Config > products > WebTSMServices > Extension > Grafana > ListSeparator → but note this will effect all other list entries as well. | searchAdvancedAttributeFilter search { advancedAttributeFilter } | list of objects | [ Short: AttributName!=Wert,... | |
| Search > Order By | Sort parameter (analog to WebTSMServices repositories/<repo>/timeseries endpoint), time series can be sorted by several time series properties in ascending or descending order. Individual sort commands can be listed comma separated, they will be processed in order. Sorting direction (asc or desc) can be specified after the respective time series property separated by a "|" character. | searchOrderBy search { orderBy } | list of strings | ["Name|asc", | |
| Search > Limit | Limits the number of returned time series (analog to WebTSMServices repositories/<repo>/timeseries endpoint). The default value can be defined in HAKOM.Config > products > WebTSMServices > Extension > Grafana > LimitQueryItems. | searchLimit search { limit } | int | 10 | LimitQueryItems |
| Search > Offset | Offset, i.e. start index in combination with the number of returned time series (analog to WebTSMServices repositories/<repo>/timeseries endpoint). | searchOffset search { offset } | int | 0 | 0 |
| Search > Extend Results by Ad Hoc Filter | Search definitions, where neither "searchNames", "searchDescription", "searchType", "searchInterval", "searchUnit" or "searchAttributes" are specified will not be executed. I.e. a Metric with "- Custom Query -", without the parameters mentioned remains empty. As soon as an AdhocFilter variable is configured, its attributes are automatically searched for. Configured search parameter will not be extended / amended by AdhocFilter variables. In order to extend configured search parameters by AdhocFilter variables set this parameter to true. | searchExtendByAdhocFilter search { extendByAdhocFilter } | true / false | true | false |
| Search > Execute empty Search | Search parameters, where neither "searchNames", "searchDescription", "searchType", "searchInterval", "searchUnit" or "searchAttributes" are specified will not be executed. I.e. a Metric with - Custom Query -, without the parameters mentioned remains empty. To start a search for all time series without a specific search pattern (e.g. to get closer to a certain time series with the help of "limit" and "offset" parameters) set this parameter to true. | searchExecuteEmptySearch search { executeEmptySearch } | true / false | true | false |
| Search > Additional Time Series Names | Use this parameter to add a fix list of time series to the result set, which are not effected by any further search parameters (e.g. attributes, descriptions etc.). | searchExactNames search { exactNames } | ["TimeSeries1", "TimeSeries%"] Short: TimeSeries1,TimeSeries% | ||
| Search > Effective Attribute From Date | Effective from date for attribute search in combination with searchAttributes (Search > Attributes) parameter. If this parameter is provided attribute values where time slice is valid at (or higher) the given date are filtered during time series search. Relative dates are supported - see chapter Entering relative date patterns. | searchEffectiveAttributeDateFrom search { effectiveAttributeDateFrom } | ISO date or relative date pattern | 2021-08-20 today+1d | |
| Search > Effective Attribute To Date | Effective to date for attribute search in combination with searchAttributes (Search > Attributes) parameter. If this parameter is provided attribute values where time slice is valid until the given date are filtered during time series search. Relative dates are supported - see chapter Entering relative date patterns. | searchEffectiveAttributeDateTo search { effectiveAttributeDateTo } | ISO date or relative date pattern | 2021-08-20 today+1d |
Annotation Parameter
Migration hint
Note: Annotation required the following changes in order to be cross Grafana version compatible:
- the "formula": {"formula": ..., "interval":... "intervalMultiplier":...} object has been flattened to the main annotation payload, otherwise new time series based annotation queries, where SimPod JSON Datasource calls the query (instead of the annotation) endpoint, would not work. Such annotations must be migrated.
- additionally in order to be able to configure annotations via Builder mode, an "annotation" prefix has been added to each annotation property. So that properties can be referenced by annoationOldPropertyName. E.g. "isRegion": true → "annotationIsRegion": true.
To get a migrated payload, post the old payload to the baseUrl/extensions/grafana/annotationpayloadconverter endpoint. See chapter Payload Converter.
| Parameter name | Description | Code / Legacy Code | Content | Example | Default |
|---|---|---|---|---|---|
| Annotation > Interval | Interval for formula calculation (see WebTSM Service /intervals - e.g.: Second, Minute, Hour, etc.). If Grafana Variable Entry Mode is off, a list of supported intervals is enlisted in Builder mode. | annotationInterval annotation { interval } (not supported: formula {interval}) | string: supported intervals | Minute | |
| Annotation > Interval Multiplier | Interval multiplier for formula calculation. | annotationIntervalMultiplier annotation { intervalMultiplier } (not supported: formula {intervalMultiplier}) | int | 15 | 1 |
| Annotation > Exact Interval | If set to true, the query period is automatically rounded to the previous exact start of a time series' interval. I.e. with an interval of one hour and a query start time of 13:46, the query will be rounded down to 13:00. This allows values of time series to be queried in intervals. The default value can be defined in HAKOM.Config > products > WebTSMSErvices > Extension > Grafana > ExactInterval. | annotationExactInterval annotation { exactInterval} | true / false | true | false |
| Annotation > Formula | Time series formula. The keyword "this" ([this], or [this,...]) is replaced with the time series passed via timeseries parameter or via Metric parameter (from Grafana 8.0). | annotationFormula annotation { formula } (not supported: formula {formula }) | string | [this].Flag | |
| Annotation > Time Series | Name of the time series for which data or attributes shall be loaded. Is obsolete as of Grafana 8.0 let the user select the time series via Metric. | annotationTimeseries annotation { timeseries} | string | My Time Series | |
| Annotation > Is Region | Controls whether annotation covers a time range or reflects only the start time of a given event. | annotationIsRegion annotation { isRegion } | true / false | true | false |
| Annotation > Value | Value of the selected time series. Only time series values that are equal to the specified value are considered. All other timestamps do not generate an annotation. | annotationValue annotation { value } | Double or String | 1 | |
| Annotation > Value Map | Mapping of time series values to a string. Which can be displayed as annotation text. Pattern: "TimeSeriesValue": "MappingValue" | annotationValueMap annotation { valueMap } | Dictionary or string | {"1":"Mapping Text", "2":"Mapping Text 2"} Short: 1|Mapping Text,2|Mapping Text 2 | |
| Annotation > Attribute Name and Value | Attribut name. Name of the time series attribute to be used. Attribut value. Value to be filtered for. If empty, all values are displayed as Annotation event. | annotationAttribute annotation { attribute } | Object or string | {"name": "Attribute Name", Short: Attribute Name|Attribute Value |
Naming conventions for Table Format
Column names are assigned according to the following rules, but can be renamed to Table Panel:
- Time series keep their respective names (or a formulaAlias is applied as name accordingly)
- Attribute columns:
- If only one time series was selected and its attributes are displayed: the attribute columns are given the respective attribute name
- If attributes of several time series are displayed, the attribute columns are named according to the following pattern: Time series name:attribute name
- If attributes are loaded from a time series specified in the background (sourceTimeseries) and noTimeseriesNameInAttributeHeader=false, the attribute columns are named according to the following pattern: sourceTimeseries:attribute name, otherwise only attribute names
- Flag columns:
- If only one time series is displayed, the column is called Flag
- If multiple time series are displayed, the column names will follow the following pattern: Time series name:Flag
Payload Converter
For migrating metric and annotation payloads the Grafana Extension offers two endpoints. Both endpoints will deserialize the provided payloads to the according internal objects and output all properties that were used.
Converting time series metric payloads
To convert any time series metric payload to a Builder mode compatible payload, POST the according payload via REST request body (e.g. using Postman) to the following endpoint: baseUrl/extensions/grafana/payloadconverter
Example input:
POST /api/extensions/grafana/payloadconverter HTTP/1.1
Host: localhost:22200
Content-Type: application/json
Content-Length: 78

{"search": {"names": ["timeseries1", "timeseries2" ] }}
Example output:
{ "searchNames": "timeseries1,timeseries2"}Disabling Array Simplification
Note: the converter stringifies and simplifies array objects out of the box.
In some cases, e.g. for MSCONS type attributes with comma in the object value, this approach leads to incorrect list splits when deserializing the stringified result to the actual array. In such cases the array stringification behaviour can be turned off by passing the query parameter "dontStringifyObjects":
Example input:
POST /api/extensions/grafana/payloadconverter?dontStringifyObjects=true HTTP/1.1
Host: localhost:22200
Content-Type: application/json
Content-Length: 78

{"search": {"names": ["timeseries1", "timeseries2" ] }}
Example output:
{"searchNames": ["timeseries1", "timeseries2"]}Also note: when entering array objects in Builder mode, it will escape them to strings, this behavior is handled, since the extension supports all three variants (array object, array object in escaped string and stringified comma separated string).
Converting annotation payloads
To convert any old annotation payload (having desupported formula: {formula ...} objects) to a Builder mode compatible payload, POST the according annotation payload via REST request body (e.g. using Postman) to the following endpoint: baseUrl/extensions/grafana/annotationpayloadconverter
Example input:
POST /api/extensions/grafana/annotationpayloadconverter HTTP/1.1
Host: localhost:22200
Content-Type: application/json
Content-Length: 143

{"timeseries": "My Time Series", "formula": {"formula": "[this].Flag", "interval": "Hour" }, "isRegion": true}
Example output:
{"annotationTimeseries": "My Time Series", "annotationIsRegion": true, "annotationFormula": "[this].Flag", "annotationInterval": "Hour"}Disabling Array Simplification
Note: the converter stringifies and simplifies array objects out of the box.
In some cases, e.g. for MSCONS type attributes with comma in the object value, this approach leads to incorrect list splits when deserializing the stringified result to the actual array. In such cases the array stringification behaviour can be turned off by passing the query parameter "dontStringifyObjects":
Payload Examples
Basic examples
Retrieve time series in unit MWh with exact audit date 2019-11-14T23:00:00Z as total aggregate
{"unit":"MWh", "audit": "2019-11-14T23:00:00Z", "exactAudit": true, "aggregation": "Sum"}Retrieve time series in 15 minute intervals exactly at 0-15-30-45 minute grid points
{"interval":"Minute", "intervalMultiplier":15, "exactInterval":true}Retrieve Ad Hoc formula (time series*-1) with unit "MWh" in 15 minutes interval exactly on the 0-15-30-45 minutes grid points
{"formula":"[this,0,MWh]*-1","formulaAlias":"My Inverse Time Series","interval":"Minute", "intervalMultiplier":15, "exactInterval":true}Define time series names as a list. (For queries using timeseriesNames, you must select Metric - Custom Query -)
{"searchNames": "MyTimeSeries1,MyTimeSeries2"}Time series from time series search with limit and attribute search. (For queries using search, you must select Metric - Custom Query -)
{"searchNames": "MyTestTimeS%", "searchType": "Begin", "searchInterval": "Hour", "searchDescription": "My time series description", "searchUnit": "MWh,
 "searchAttributes": "MyAttribute1,MyAttribute2|Value", "searchLimit": 100, "searchOffset": 0}
Display Name usage examples
Simple query with display name
{"interval": "Hour", "displayName": "[Name]+ (+[Description]+)"}Time series search combined with display name
{"searchNames": "Consumption%", "displayName": "[Name]+ (+[Description]+)"}TreeNodeSum including time series combined with display name
{"displayName": "[Name]+ (+[ID]+)", "treeNodeSumName": "$rootNodes", "treeNodeSumIncludeTimeSeries": true, "treeNodeSumIncludeSum": false, "treeNodeSumExtendByAdhocFilter": "$extendByAdhocFilter", "exactInterval":"$controlExactInterval", "unit": "MWh"}Tree Node examples
Loads a TreeNodeSum aggregate (that is, the sum of the selected TreeNode):
{"unit":"KWh", "treeNodeSumName": "MyTree"}Loads a subnode aggregate (that is, the sum of the selected subnode ID):
{"unit":"KWh", "treeNodeSumName": "MyTree", ""treeNodeSumNodeId":10}Loads all time series data in the selected TreeNode:
{"unit":"KWh", "treeNodeSumName": "MyTree", "treeNodeSumIndludeSum": false, "treeNodeSumIncludeTimeSeries": "true"}Loads all time series data in the selected subnode:
{"unit":"KWh", "treeNodeSumName": "MyTree", "treeNodeSumNodeId":10, "treeNodeSumIndludeSum": false, "treeNodeSumIncludeTimeSeries": "true"}Loads all sub-subnode totals inside the selected subnodes:
{"unit":"KWh", "treeNodeSumName": "MyTree", "treeNodeSumNodeId":10, "treeNodeSumIndludeSum": false, "treeNodeSumIncludeSubNodes": "true"}Loads both the subnode total and all time series data and sub-subnodes inside the selected subnodes:
{"unit":"KWh", "treeNodeSumName": "MyTree", "treeNodeSumNodeId":10, "treeNodeSumIncludeTimeSeries": true, "treeNodeSumIncludeSubNodes": "true"}Loads a TreeNodeSum aggregate, which can be switched to a subnode via Grafana AdHocFilter Variable.
{"unit":"KWh", "treeNodeSumName": "MyTree", "treeNodeSumExtendByAdhocFilter": true}Loads 5 time series data and skips 10 time series in the selected TreeNode.
{"unit": "KWh", "treeNodeSumName": "MyTree", "treeNodeSumIndludeSum": false, "treeNodeSumIncludeTimeSeries": "true", "treeNodeSumLimitTimeSeries": 5, "treeNodeSumOffsetTimeSeries": 10}Columns examples
Display time series with flags (as flag name)
{"columnsShowFlag": "Name"}Display time series with all attributes and flags
{"columnsShowFlag": "Name", "columnsAllAttributes": true}Define time series names as list, get flags as id (Result: for all listed time series the flags are displayed, in both line graphs and table panels. The flags are listed under "time series name:flag").
Note: to retrieve flags as name, use "showFlag": "name" instead. (For queries using timeseriesNames, you must select Metric - Custom Query -)
{"searchNames": "MyTimeSeries1,MyTimeSeries2", "columnsShowFlag": "id"}Define time series names as list, retrieve only specific attributes (result: for both time series the listed attributes are loaded if any assigned)
{"searchNames": "MyTimeSeries1,MyTimeSeries2",
 "columnsCustomList": "MyAttribute1,MyAttribute2"}
Define time series names as a list, retrieve only specific attributes from only one specific time series (result: data is loaded for both time series, attributes are loaded from the designated sourceTimeseries)
{"searchNames": "MyTimeSeries1,MyTimeSeries2",
 "columnsCustomList": "MyAttribute1,MyAttribute2", "columnsSourceTimeseries": "MyTimeSeriesWithAttribute"}
Retrieve time series from time series search with limit and attribute search and specific attributes defined (result: all time series found within the specified limit and the specified attributes, if assigned, are loaded)
{"searchNames": "MyTestTimeS%", "searchType": "Begin", "searchInterval": "Hour", "searchDescription": "My time series description", "searchUnit": "MWh,
 "searchAttributes": "MyAttribute1,MyAttribute2|Value", "searchLimit": 100, "searchOffset": 0,
 "columnsCustomList": "MyAttribute1,MyAttribute2"}
Annotations
Time-related information with textual context, such as certain events in Grafana, can be recorded and displayed. Such events can also be retrieved from an external JSON data source via /annotations path. Individual annotations can be visualized as individual points in time or time ranges (region).
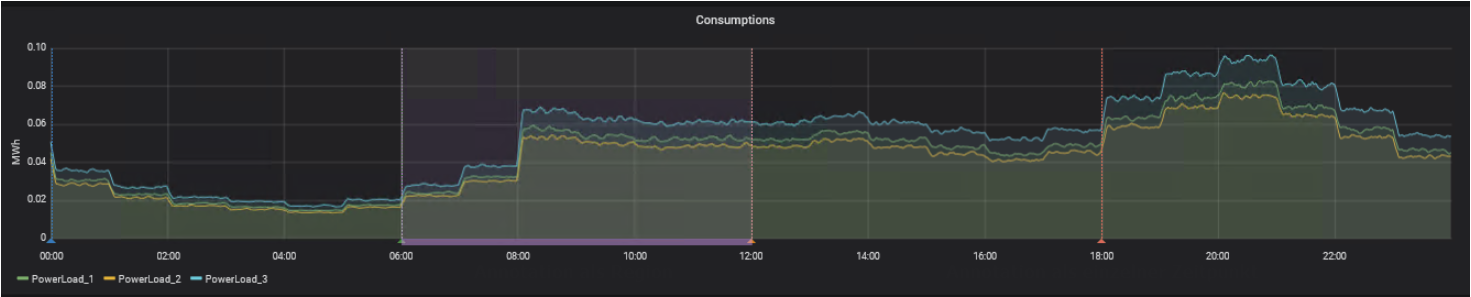
In HAKOM TSM such events can be displayed via attributes and time slices or directly via time series containing category values.
NOTE: with Grafana 8.0 / SimPod 0.3.0 the definition of annotations are all unified using time series queries.
Annotation query
The annotation query works (since Grafana 8.0) similar to time series metric query. With the latest version you can also use the Builder mode, to configure the necessary parameters.
Annotation from TSM attribute
Grafana - Dashboard - Settings - Annotations - New Query
- Select a name in the Annotations dialog under Name
- Select a JSON data source in Data source
- Define, whether the annotation is displayed and with which display color to select
- Under Query - Mode, select Builder (if available, otherwise add the according annotation payloads manually)
- Select a Metric e.g. - Custom Query - (and search for a time series using Search Parameter see chapter Search Parameter), or select a time series name. The Builder parameter are displayed.
- Turn "Show Annotation Parameter" on, to display all annotation specific parameter.
- Finally configure the annotation parameter accordingly:
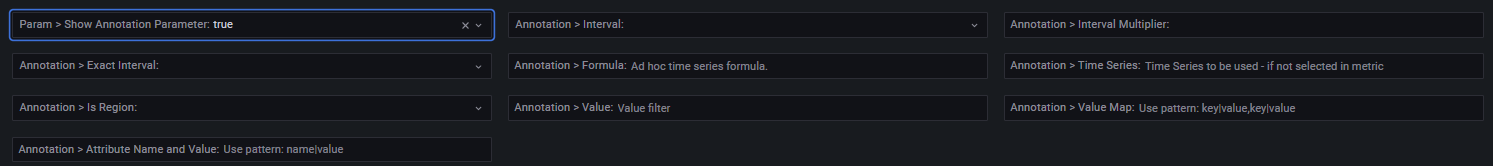
To get an attribute:
Set Annotation > Attribute Name and Value to the required attribute name: attribute_name
or add the following Payload:XML{"annotationAttribute": "attribute_name"}To get an attribute and filter by a specific attribute value:
Set Annotation > Attribute Name and Value to the required attribute name|value pair: attribute_name|attribute_value
or add the following Payload:XML{"annotationAttribute": "attribute_name|attribute_value"}To get an attribute displayed as region (colored time span while the attribute value is valid):
Set Annotation > Attribute Name and Value to the required attribute name: attribute_name
Set Annotation > Is Region to true
or add the following Payload:XML{"annotationIsRegion":true,"annotationAttribute":"attribute_name"}To get an attribute and filtering by a specific attribute value displayed as region (colored time span while the attribute value is valid):
Set Annotation > Attribute Name and Value to the required attribute name|value pair: attribute_name|attribute_value
Set Annotation > Is Region to true
or add the following Payload:XML{"annotationIsRegion":true,"annotationAttribute":"attribute_name|attribute_value"}
Annotation from TSM time series
Grafana - Dashboard - Settings - Annotations - New Query
- Select a name in the Annotations dialog under Name
- Select a JSON data source in Data source
- Define, whether the annotation is displayed and with which display color to select
- Under Query - Mode, select Builder (if available, otherwise add the according annotation payloads manually)
- Select a Metric e.g. - Custom Query - (and search for a time series using Search Parameter see chapter Search Parameter), or select a time series name. The Builder parameter are displayed.
- Turn "Show Annotation Parameter" on, to display all annotation specific parameter.
- Finally configure the annotation parameter accordingly:
To get time series values of the selected metric:
Set Annotation > Exact Interval to true (optional)
or add the following Payload:XML{"annotationExactInterval": true}To get time series values of the selected metric filtered by a specific value:
Set Annotation > Exact Interval to true (optional)
Set Annotation > Value to the required value
or add the following Payload:XML{"annotationValue":1, "annotationExactInterval": true}To get time series values of the selected metric displayed as region (colored time span while the time series value is unchanged):
Set Annotation > Exact Interval to true (optional)
Set Annotation > Is Region to true
or add the following Payload:XML{"annotationIsRegion":true, "annotationExactInterval": true}To get time series values of the selected metric filtered by a specific value displayed as region (coloured time span while the time series value is unchanged):
Set Annotation > Exact Interval to true (optional)
Set Annotation > Value to the required value
Set Annotation > Is Region to true
or add the following Payload:XML{"annotationIsRegion":true,"annotationValue":1, "annotationExactInterval": true}To get time series values of the selected metric mapped to specific text values:
Set Annotation > Exact Interval to true (optional)
Set Annotation > Value Map using the following pattern: <value to be mapped>|<map value>,<further value>|<further map value>... e.g.: 1|Mapping Text,2|Mapping Text 2
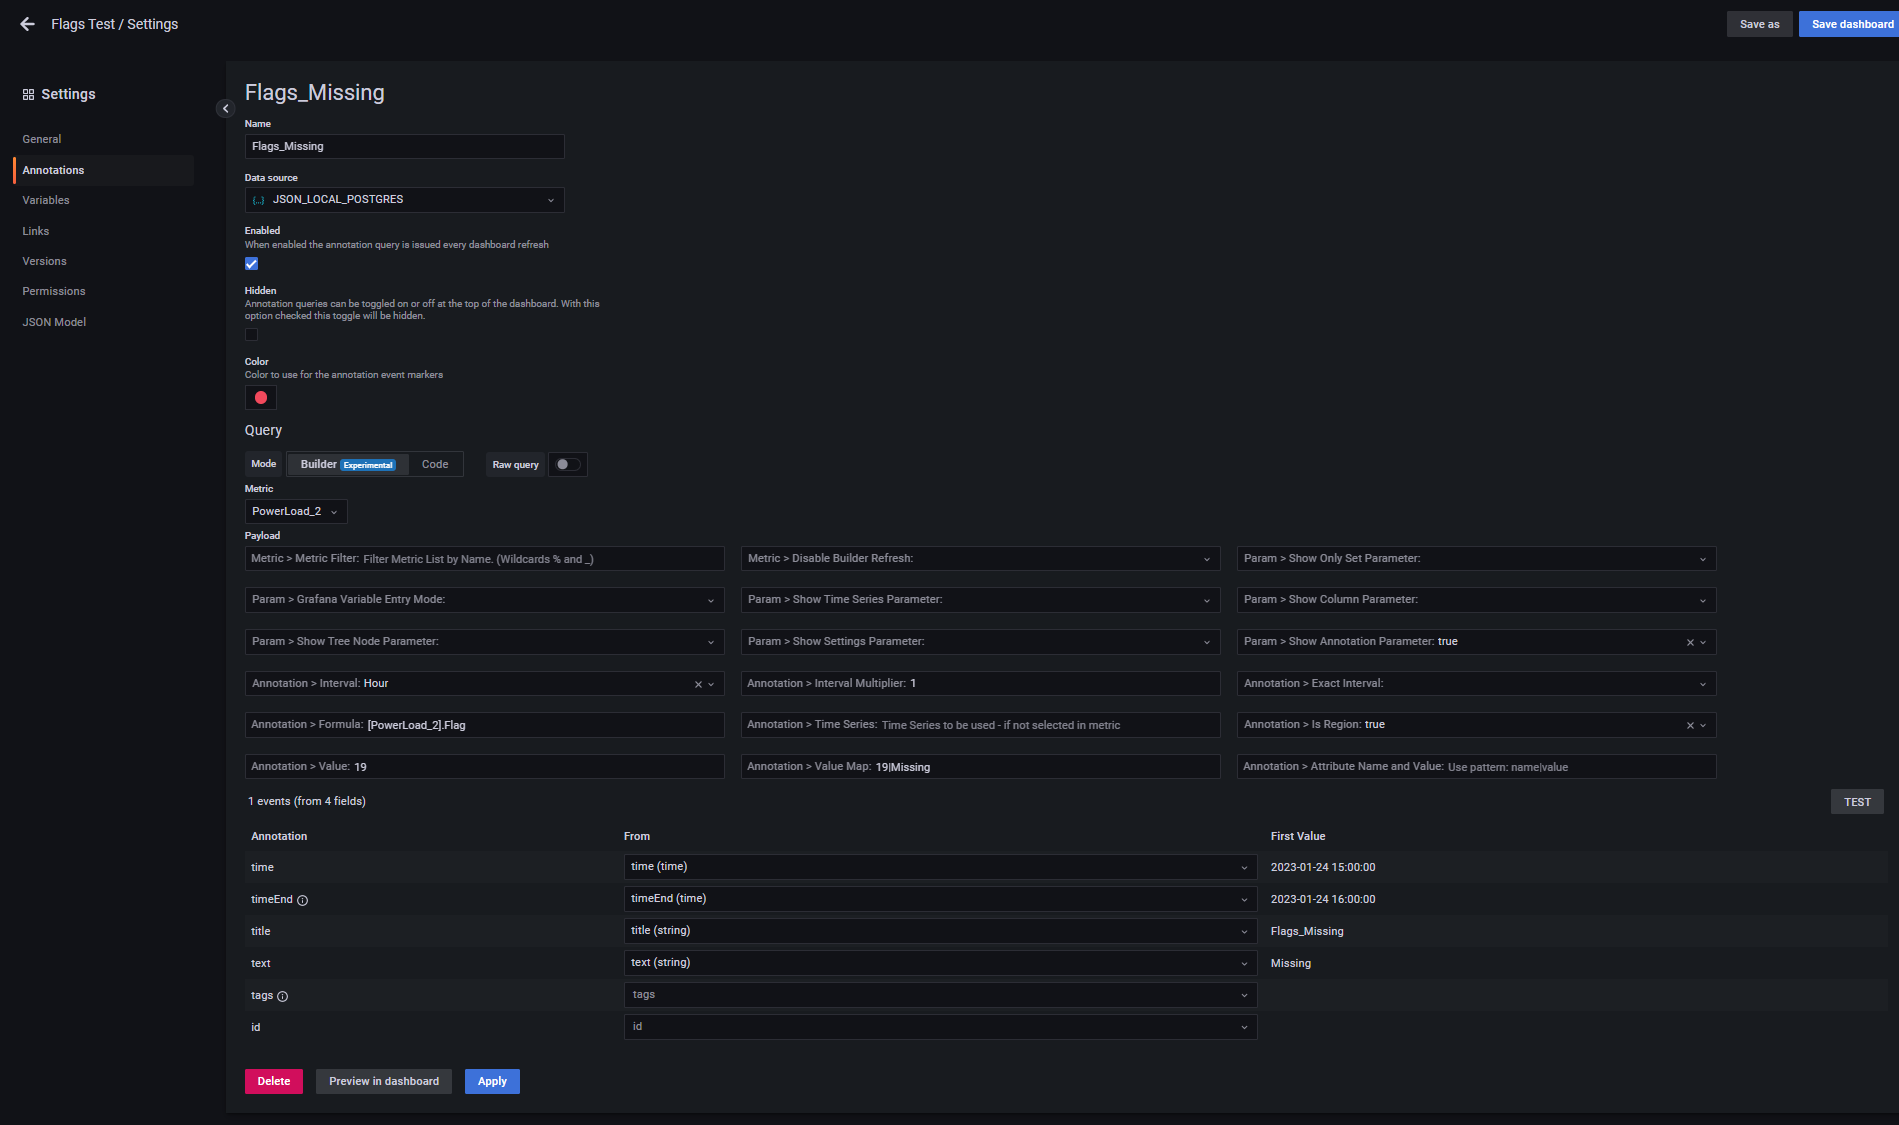
or add the following Payload:XML{"annotationValueMap": "1|Mapping Text,2|Mapping Text 2", "annotationExactInterval": true}To get ad hoc calculated time series values (based on the selected metric) mapped to specific text (e.g. to display flags as annotation colours):
Set Annotation > Exact Interval to true (optional)
Set Annotation > Formula to the required calculation formula, e.g. to get Flags of the selected time series: [this].Flag
Set Annotation > Interval to the required calculation interval, e.g.: Hour
Set Annotation > Interval Multiplier (optional)
Set Annotation > Value Map using the following pattern: <value to be mapped>|<map value>,<further value>|<further map value>... e.g.: 1|Mapping Text,2|Mapping Text 2
or add the following Payload:XML{"annotationFormula": "[this].Flag", "annotationInterval": "Hour", "annotationIntervalMultiplier": 1, "annotationValueMap": "9|Valid,19|Missing", "annotationExactInterval": true}Sample:
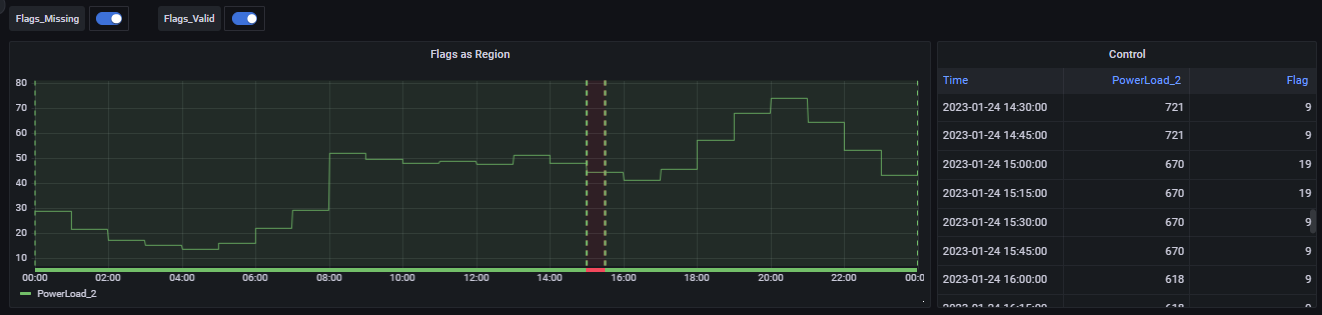
Note: the tag "annotationExactInterval": true in the above examples is used to roll out the time series values exactly on the interval defined on the time series. If this is not set, the interval is shifted by the start time given by Grafana.
Grafana Variables
Using Tags and the Ad hoc Filters Variables
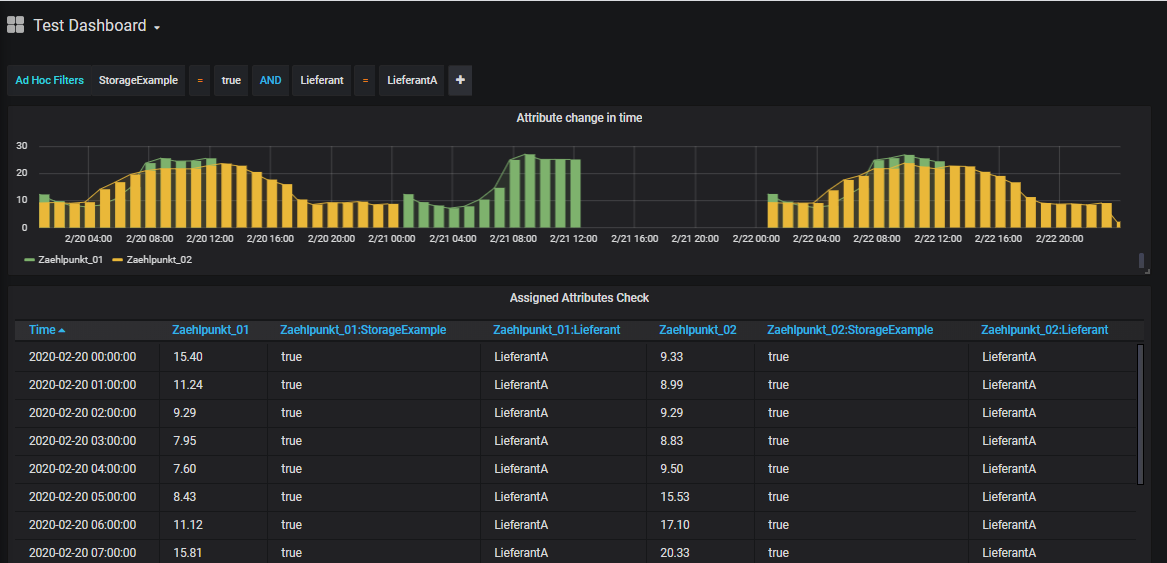
To use tags and ad hoc filters in Grafana, a Grafana variable of the type "Ad hoc filters" must be defined (for each data source). This can be done in the Dashboard Settings - Variables:
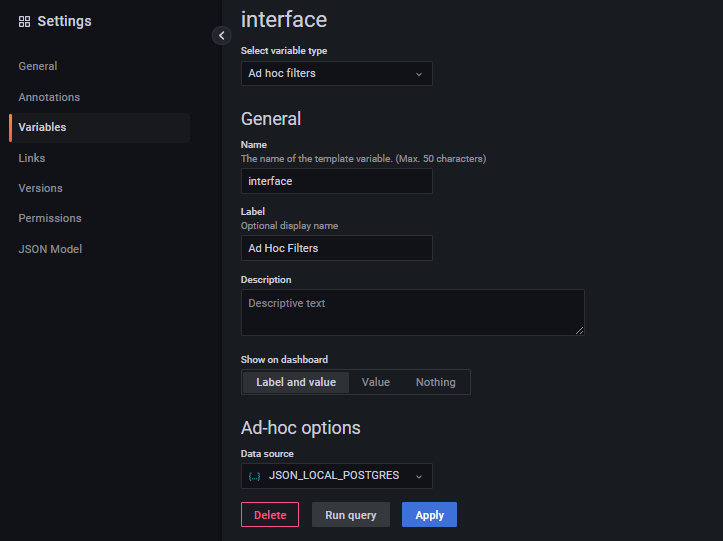
An AdhocFilters control is then displayed on the dashboard, where the list of available tags and, next to the comparison operator, the list of available tag values (i.e. distinct values from all time series attribute assignments) are listed:
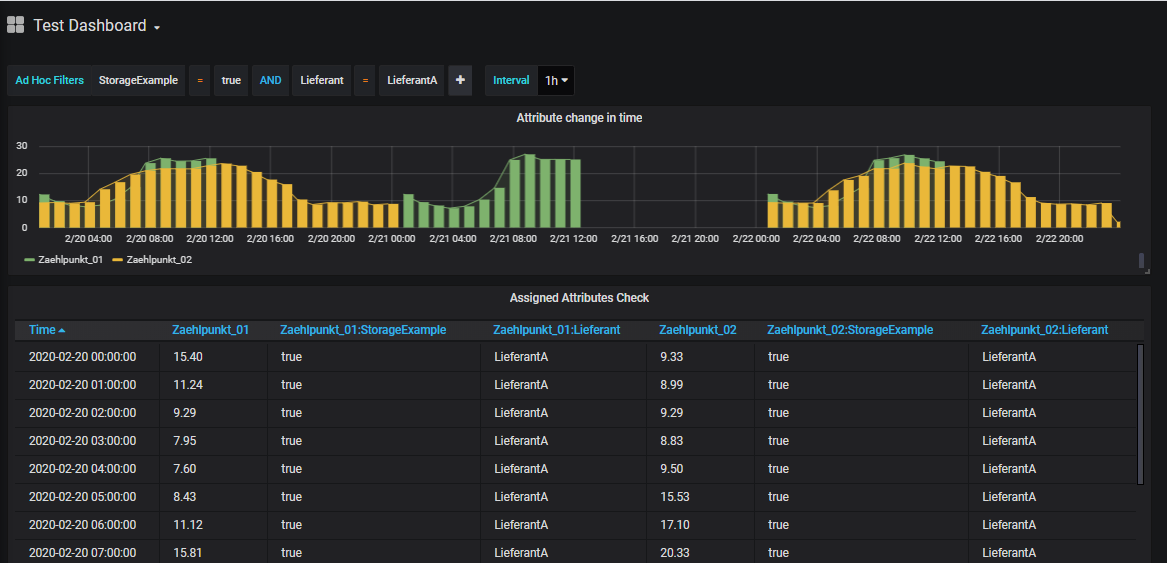
Note: AdhocFilters are applied to all existing data. If time series searche defined in Payload has to be extended by further attributes selected in the AdhocFilter, the searchExtendByAdhocFilter:true parameter (see chapter Search Parameter → Search > Extend Results by Ad Hoc Filter) must be configured to true.
Using Interval Variable
In Grafana, intervals can be predefined to group time periods according to the selected interval across dashboards.
To use Grafana Interval variables a Grafana variable of type "Interval" with the name "Interval" (or with the name specified in HAKOM.Config > products > WebTSMServices > Extensions > Grafana > IntervalVariableName) must be defined. If another text is to be displayed instead of "Interval", this can be achieved by using the "Label" field:
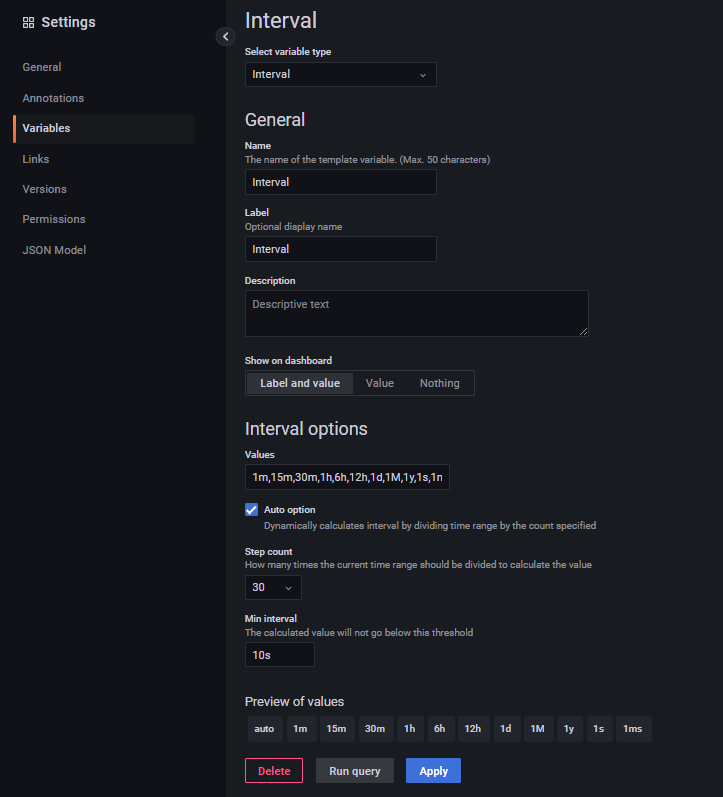
The following interval identifiers are supported:
- ms: Milliseconds - Example: 1ms
- s: seconds - Example: 1s
- m: minute - example: 15m
- h: hour - example: 1h
- d: Days - Example: 1d
- w: weeks - Example: 1w
- M: months - Example: 1M
- q: Quarters - Example: 1q
- y: years - Example: 1y
After configuring the variable, it appears on the dashboard and can be used accordingly:
Note: Interval variable overrides the interval calculated by Grafana, but it does not override intervals configured in Payload parameters, unless it is explicitely enabled via overrirdeWithGreaterInterval: true (see chapter Settings Parameter → Settings > Override with Greater Interval).
Using Custom Variable to model Interval Variable
In case there are issues with the Interval Variable behaviour (e.g. like in Grafana 7.x) alternatively a Custom Variable can be used to model an Interval Variable.
For this, a Grafana variable of type "Custom" with the name "Interval" (or with the name specified in HAKOM.Config > products > WebTSMServices > Extensions > Grafana > IntervalVariableName) must be defined. If another text is to be displayed instead of "Interval", this can be achieved with the help of the "Label" field:

In Cusom Options the same interval names as described above under Interval Variable can be used:
- ms: Milliseconds - Example: 1ms
- s: seconds - Example: 1s
- m: minute - example: 15m
- h: hour - example: 1h
- d: Days - Example: 1d
- w: weeks - Example: 1w
- M: months - Example: 1M
- q: Quarters - Example: 1q
- y: years - Example: 1y
Additionally, the option "auto" can be added (as shown above). This corresponds somewhat restricted to the "Auto Option" of the Interval variable, i.e. if this is selected, the interval suggested by Grafana depending on the selected period is used.
After configuring the variable, it appears on the dashboard and can be used accordingly:
Note: the variable overrides the interval calculated by Grafana, but it does not override intervals configured in Payload parameters, unless it is explicitely enabled via overrirdeWithGreaterInterval: true (see chapter Settings Parameter → Settings > Override with Greater Interval).
Using Text Box and Custom Variable Types in Payload
To display additional variables on the dashboard that can be mapped to Payload parameters, it is also possible to use text box or custom variable types.
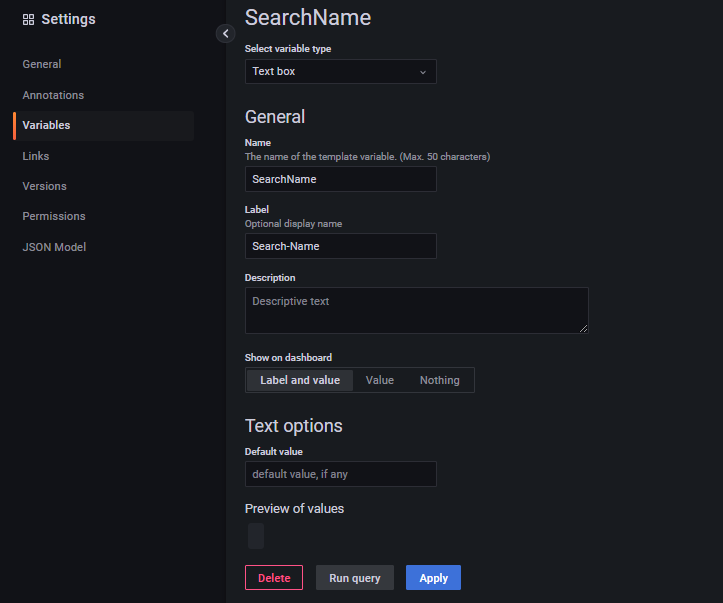
In Code mode the variable name must currently be inserted between quotes as value in the according Payload parameters entry using following pattern: "$VariableName". In Builder mode, the $VariableName can be entered in any input field.
Enter variables in lists
Note: to enter Grafana Variable names in Builder modes selection lists (e.g. aggregation, unit or interval), set Param > Grafana Variable Entry Mode to true (see chapter Builder Control Parameter)Example
To perform a time series search with name, description, etc. via Payload Search Parameter we create a variable for each time series search parameter:
- SearchName - Type: Text Box
- SearchType - Type: Text Box
- SearchInterval - Type: Text Box
- SearchDescription - Type: Text Box
- SearchUnit - Type: Text Box
- SearchAttributes - Type: Text Box
- SearchAdvancedAttributeFilter - Type: Text Box
- SearchextendByAdhocFilter - Type: Custom (without multiple selection), List: true,false
- ControlExactInterval - Type: Custom (without multiple selection), List: true,false
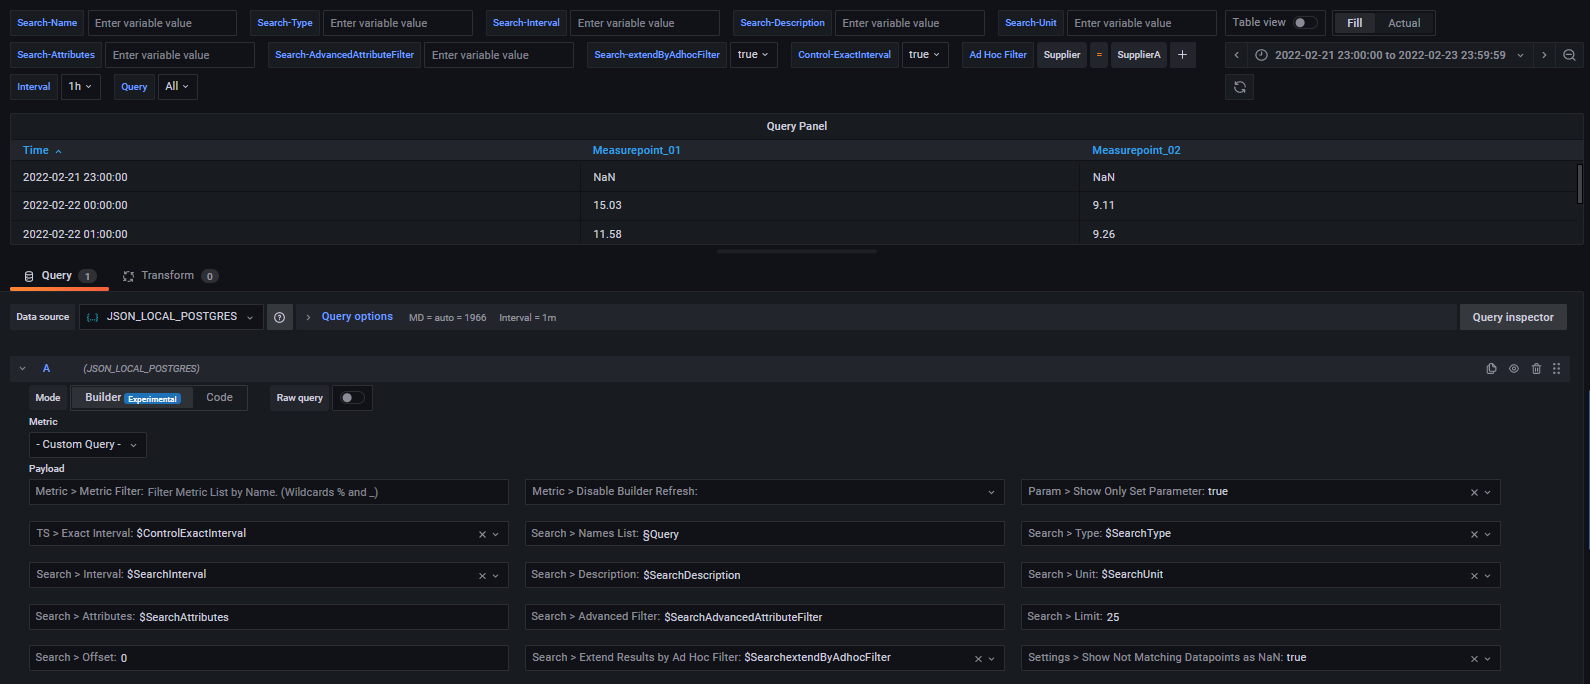
The variable names can be referenced in Payload between quotation marks (or in Builder parameter without quotation marks), each starting with a $ character:
{"exactInterval":"$ControlExactInterval",
 "searchNames": "$SearchName", "searchType": "$SearchType", "searchInterval": "$SearchInterval",
 "searchDescription": "$SearchDescription","searchUnit": "$SearchUnit",
 "searchAttributes": "$SearchAttributes","searchAdvancedAttributeFilter":"$SearchAdvancedAttributeFilter",
 "searchLimit": 25,"searchOffset": 0, "searchExtendByAdhocFilter": "$SearchextendByAdhocFilter"}
The same way Tree Node Parameter (both in Standard and Trees Datasource) can be configured:
{"exactInterval":"$ControlExactInterval",
 "treeNodeSumTimeSeriesName": "$SearchName", "treeNodeSumAttributes": "$SearchAttributes", "treeNodeSumIncludeTimeSeries": true,
 "treeNodeSumLimitTimeSeries": 25, "treeNodeSumOffsetTimeSeries": 0, "treeNodeSumExtendByAdhocFilter": "$SearchextendByAdhocFilter"}
Note: Tree Node Parameter do not support the properties "interval", "description" and "unit".
Using the filters in the GUI:
- Text: can be entered as simple text (e.g.: time series name1)
- Integer: can be entered as simple text (e.g.: 25)
- Boolean: can be entered as simple text (e.g. true)
- Lists: can be entered as comma separated values (e.g. time series name1,time series name2) without space
- Attributes: see lists, attribute|value pairs can be entered using the pipe '|' separator (e.g.: attribute1|value1,attribute2|value2,attribute3)
- AdvancedAttributFilter: see lists, attribute+operator+value combinations can easily be written together (e.g. attribute1=value1,attribute2!=value3)
Using Query Variables in Payload
Using Query Variables a multi selection list for prefiltered time series names can be configured and used them in Payload (e.g. Search > Names List aka "searchNames"). If required, the list can be filtered using regex patterns.
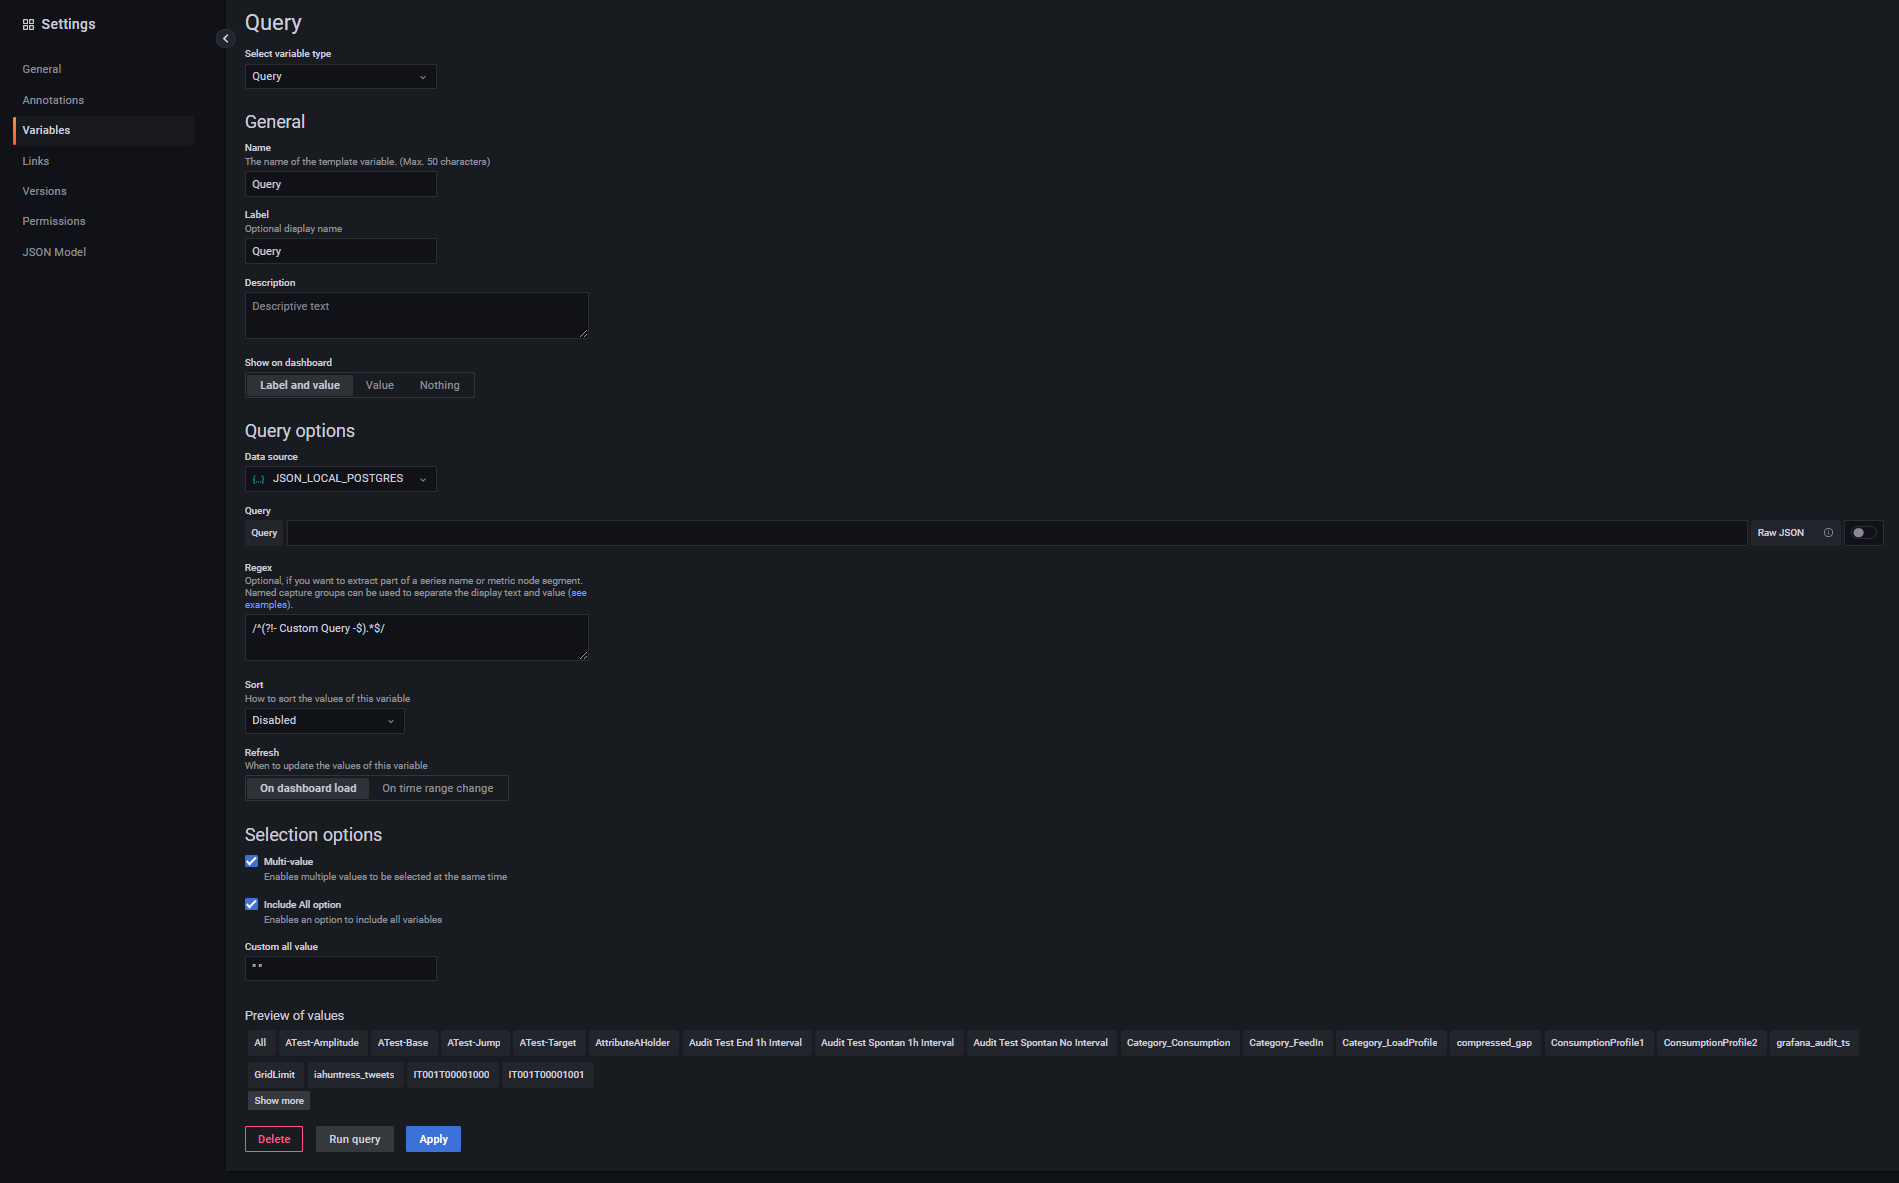
Defining a Query Variable:
Gereral:
- Name: any name can be chosen
- Type: Query
- Label: any label can be chosen
Query Options:
- Data source: any JSON Data Source
- Refresh: either "On Dashboard Load" or "On Time Range Change" → since time series list does not change with time range change, "On Dashboard Load" shall be preferred.
- Query: Enter any part of the time series (with wildcards) to filter the list of time series. (If HAKOM.Config > products > HAKOMFramework > settings > TimeSeriesSearchExact setting is true, the search wildcard % must be inserted at the end of the time series name to use wildcard search).
Regex: to hide the Custom Query entry ("- Custom Query -") from the time series names query, use the following Regex pattern:
/^(?!- Custom Query -$).*$/
Selection Options:
- Multi-Value: if several time series are to be selected simultaneously: yes (Attention, multiple selection variables require with JSON Datasource 0.1.7 the HAKOM.Config entry "UseJsonDataSourceQueryFix" = true being enabled, otherwise the interface cannot process the request)
- Include All option: due to a Grafana bug in some Grafana versions (e.g. 6.4.4) Multi-Value Lists can not be emptied from the dashboard again to no selection. As such clear selection leads to the first entry being selected. If Multi-Value is activated, this option should be activated as well, so that "All" is being displayed as first item, and as such the selection jumps to "All" when the list is emptied. Note: please also read "Custom all value" option below.
- Custom all value: In combination with "Multi-Value" and "Include All", you can define what the variable should transmit when "All" is selected. By default the complete time series list available from /Search path (i.e. the first 100 entries) is selected. This makes only limited sense. We recommend to use the "Custom all value" to solve the problem described issue regarding unable to empty multi-value list selections. To do this, enter a blank entry, i.e. " " (including quotation marks) here. Because HAKOM TSM does not allow time series with only one " " space, these are automatically filtered out in the search, so that a space entry (contrary to All) does not apply any filtering. If the user wants to list all entries, an empty query can be forced to list all time series with the search parameter "executeEmptySearch".
Using Query Variable
Note: there is a limitation in the latest Grafana 9.x SimPod JSON Datasource 0.6.0 plugin, which removes Query Variables from Payload, when correctly referencing them using $QueryVariableName pattern.
To bypass this limitation, ensure that HAKOM.Config > products > WebTSMServices > Extensions > Grafana > UseJsonDataSourceVariableReplaceFix is not disabled and use "§" instead of "$" as variable name marker: §QueryVariableName.
Note: the Query Variable name marker can be configured in HAKOM.Config > products > WebTSMServices > Extensions > Grafana > QueryVariableMarker, however the value "$" should not be used, since this will cause the above mentioned issue.
The query variable is best used in "searchNames" parameter:
{"exactInterval":"$ControlExactInterval",
 "searchNames": "§Query", "searchType": "$SearchType", "searchInterval": "$SearchInterval",
 "searchDescription": "$SearchDescription","searchUnit": "$SearchUnit",
 "searchAttributes": "$SearchAttributes","searchAdvancedAttributeFilter":"$SearchAdvancedAttributeFilter",
 "searchLimit": 25,"searchOffset": 0, "searchExtendByAdhocFilter": "$SearchextendByAdhocFilter"}
Other Grafana Panels
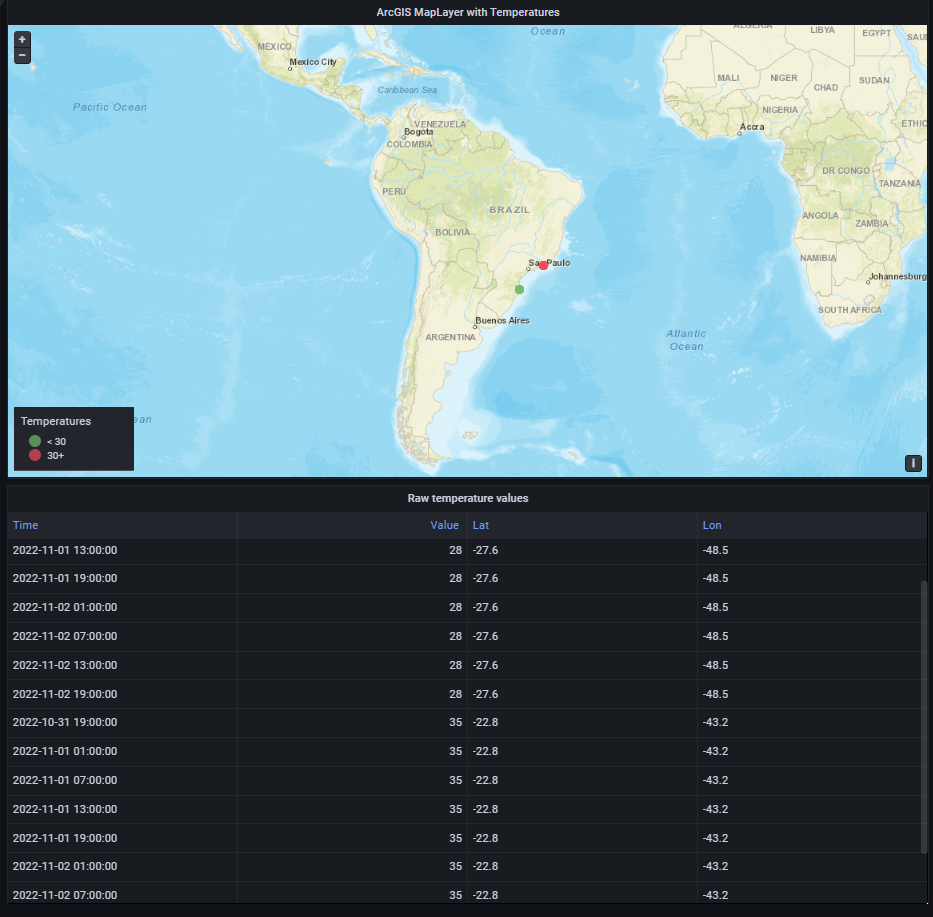
Configuring Geomap panel
The Geomap panel provides a simple way to visualize geographically distributed time series values on a selected map.
Modelling geo-specific data
In HAKOM Time Series Management for each location a separate time series has to be created. Each time series will contain data for its specific location. In order to configure the location of the time series, two time series attributes, "Lat" and "Lon" must be assigned, which contains the actual latitude and longitude positions of a given location.
Loading geo-specific data into Geomap
Geomap plugin requires time series tables containing one time stamp, only one value column, and one Lon and Lat column. As such if multiple time series are added to Geomap without further configuration, Geomap will only pick up the first time series values.
To add multiple time series to Geomap, the data model of those time series must be merged into a single value stream, using Column > Merge Series for Geomap aka "columnsMerge" parameter (see Columns Parameter).
Configuration steps:
- Create a new panel
- Select Geomap plugin (on the right top - plugins list)
- In Query section create a single query for all time series (preferred way).
- Set Metric to - Custom Query -
Enable Show Time Series Parameters and
Set TS > Interval
Set TS > Interval Multiplier
Set TS > Exact Interval parameters (if necessary)
or add to payload the following code (replace ... with your interval):CODE{"interval": "...", "intervalMultiplier": 1, "exactInterval": true }Enable Show Search Parameters and
Set Search > Names List or any other parameter to find the according time series. E.g. Search > Attributes
or add to payload the according code. E.g. to search for time series with Attribute "Lon" use the following:CODE{"searchAttributes": "Lon", "interval": "...", "intervalMultiplier": 1, "exactInterval": true }Enable Show Columns Parameters and
Set Columns > Merge Series for Geomap to true
or add to payload the following code:CODE{"columnsMerge": true, "searchAttributes": "Lon", "interval": "...", "intervalMultiplier": 1, "exactInterval": true }
Using multiple queries
In case metrics are selected via multiple queries, each query must have the "columnsMerge" parameter.